| XCEL Energy Inc (XEL) | |||
|---|---|---|---|
| 55.435 0.105 (0.19%) | 04-25 12:12 | ||
| Open: | 55.51 | Pre. Close: | 55.33 |
| High: | 55.69 | Low: | 54.35 |
| Volume: | 2,797,769 | Market Cap: | 30,792(M) |
| Stock Technical Analysis | |
|---|---|
| Overall: |  |
| Target: | Six months: 65.05 One year: 75.97 |
| Support: | Support1: 53.15 Support2: 51.58 |
| Resistance: | Resistance1: 55.69 Resistance2: 65.05 |
| Pivot: | 54.04 |
| Moving Averages: | MA(5): 55.12 MA(20): 53.98 MA(100): 57.45 MA(250): 59.79 |
| MACD: | MACD(12,26): 0.36 Signal(12,26,9): 0.08 |
| %K %D: | %K(14,3): 91.29 %D(3): 91.78 |
| RSI: | RSI(14): 60.91 |
| 52-Week: | High: 70.72 Low: 46.79 Change(%): -21.3 |
| Average Vol(K): | 3-Month: 5752 10-Days: 3746 |
| Prices Prediction (Update @5:00pm) | ||
|---|---|---|
| If tomorrow: | Open lower | Open higher |
| High: | 55.673 - 55.838 | 55.838 - 56.022 |
| Low: | 53.65 - 53.851 | 53.851 - 54.076 |
| Close: | 54.972 - 55.278 | 55.278 - 55.622 |
| Price, MAs and Bollinger Bands |
|---|
| Price has closed above its short-term moving average. Short-term moving average is currently above mid-term; and below long-term moving average. From the relationship between price and moving averages: This stock is BULLISH in short-term; and NEUTRAL in mid-long term.[ XEL ] has closed below upper band by 13.6%. Bollinger Bands are 28.7% narrower than normal. The current width of the bands does not suggest anything about the future direction or movement of prices. |
| Company profile |
|---|
| Xcel Energy Inc., through its subsidiaries, generates, purchases, transmits, distributes, and sells electricity. It operates through Regulated Electric Utility, Regulated Natural Gas Utility, and All Other segments. The company generates electricity through coal, nuclear, natural gas, hydroelectric, solar, biomass, oil, wood/refuse, and wind energy sources. It also purchases, transports, distributes, and sells natural gas to retail customers, as well as transports customer-owned natural gas. In addition, the company develops and leases natural gas pipelines, and storage and compression facilities; and invests in rental housing projects, as well as procures equipment for the construction of renewable generation facilities. It serves residential, commercial, and industrial customers in the portions of Colorado, Michigan, Minnesota, New Mexico, North Dakota, South Dakota, Texas, and Wisconsin. The company sells electricity to approximately 3.7 million customers; and natural gas to approximately 2.1 million customers. Xcel Energy Inc. was incorporated in 1909 and is headquartered in Minneapolis, Minnesota. |
| Stock chart |
|---|
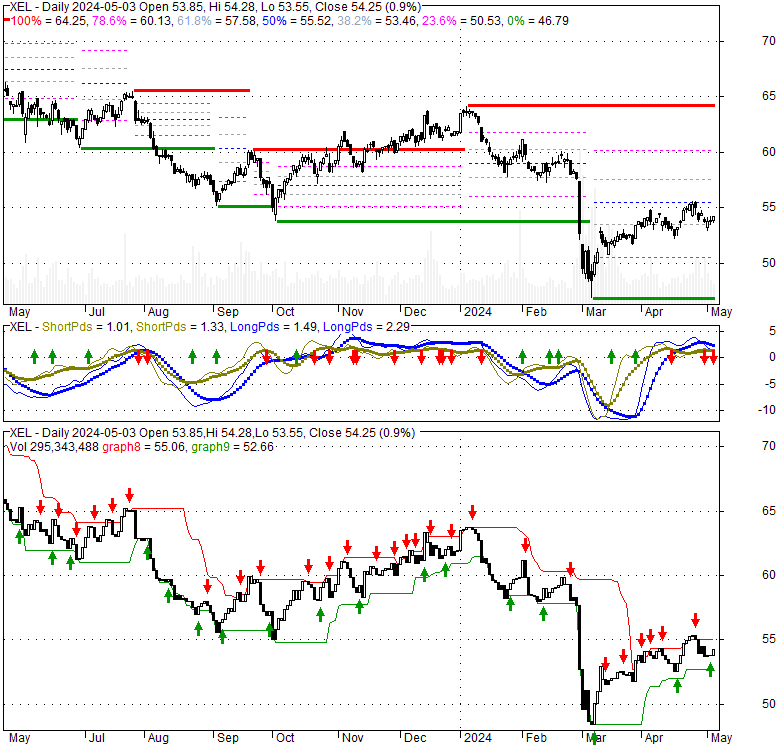 |
| Financial Analysis | |
|---|---|
| Price to Book Value: | Outperform |
| P/BV, a ratio used to compare book value to its current market price, to gauge whether a stock is valued properly. | |
| Price to Earnings: | Outperform |
| PE, the ratio for valuing a company that measures its current share price relative to its earnings per share (EPS). | |
| Discounted cash flow: | Outperform |
| DCF, a valuation method used to estimate the value of an investment based on its expected future cash flows. | |
| Return on Assets: | Neutral |
| ROA, indicates how profitable a company is in relation to its total assets, how efficiently uses assets to generate a profit. | |
| Return on Equity: | Neutral |
| ROE, a measure of financial performance calculated by dividing net income by equity. a gauge of profitability and efficiency. | |
| Debt to Equity: | Outperform |
| evaluate financial leverage, reflects the ability of equity to cover outstanding debts in the event of a business downturn. | |
| Stock Basics & Statistics | |
|---|---|
| Exchange: NASDAQ Global Select | |
| Sector: Utilities | |
| Industry: Regulated Electric | |
| Shares Out. (M) | 555.47 |
| Shares Float (M) | 554.08 |
| % Held by Insiders | 0.17 |
| % Held by Institutions | 82.14 |
| Shares Short (K) | 7670 |
| Shares Short Prior Month (K) | 7530 |
| Stock Financials | |
|---|---|
| EPS | 3.210 |
| Book Value (p.s.) | 31.740 |
| Profit Margin | 12.47 |
| Operating Margin | 19.03 |
| Return on Assets (ttm) | 2.6 |
| Return on Equity (ttm) | 10.3 |
| Qtrly Rev. Growth | -15.1 |
| Gross Profit (p.s.) | |
| Sales Per Share | 25.582 |
| EBITDA (p.s.) | 9.325 |
| Qtrly Earnings Growth | 6.80 |
| Operating Cash Flow (M) | 5330.00 |
| Levered Free Cash Flow (M) | -1060.00 |
| Stock Valuation | |
|---|---|
| PE Ratio | 17.23 |
| PEG Ratio | 2.25 |
| Price to Book value | 1.74 |
| Price to Sales | 2.16 |
| Price to Cash Flow | 5.76 |
| Stock Dividends | |
|---|---|
| Dividend | |
| Dividend Yield | |
| Dividend Growth | |


