| XP Inc Cl A (XP) | |||
|---|---|---|---|
| 20.64 0.07 (0.34%) | 04-24 16:00 | ||
| Open: | 20.53 | Pre. Close: | 20.57 |
| High: | 20.66 | Low: | 20.17 |
| Volume: | 4,452,774 | Market Cap: | 11,312(M) |
| Stock Technical Analysis | |
|---|---|
| Overall: |  |
| Target: | Six months: 27.84 One year: 30.48 |
| Support: | Support1: 20.17 Support2: 16.78 |
| Resistance: | Resistance1: 23.83 Resistance2: 26.09 |
| Pivot: | 22.79 |
| Moving Averages: | MA(5): 20.88 MA(20): 23.41 MA(100): 24.68 MA(250): 23.20 |
| MACD: | MACD(12,26): -1.15 Signal(12,26,9): -0.80 |
| %K %D: | %K(14,3): 6.88 %D(3): 5.44 |
| RSI: | RSI(14): 21.56 |
| 52-Week: | High: 27.71 Low: 12.78 Change(%): 55.1 |
| Average Vol(K): | 3-Month: 5464 10-Days: 5954 |
| Prices Prediction (Update @5:00pm) | ||
|---|---|---|
| If tomorrow: | Open lower | Open higher |
| High: | 20.678 - 20.824 | 20.824 - 20.937 |
| Low: | 19.898 - 20.052 | 20.052 - 20.172 |
| Close: | 20.437 - 20.678 | 20.678 - 20.864 |
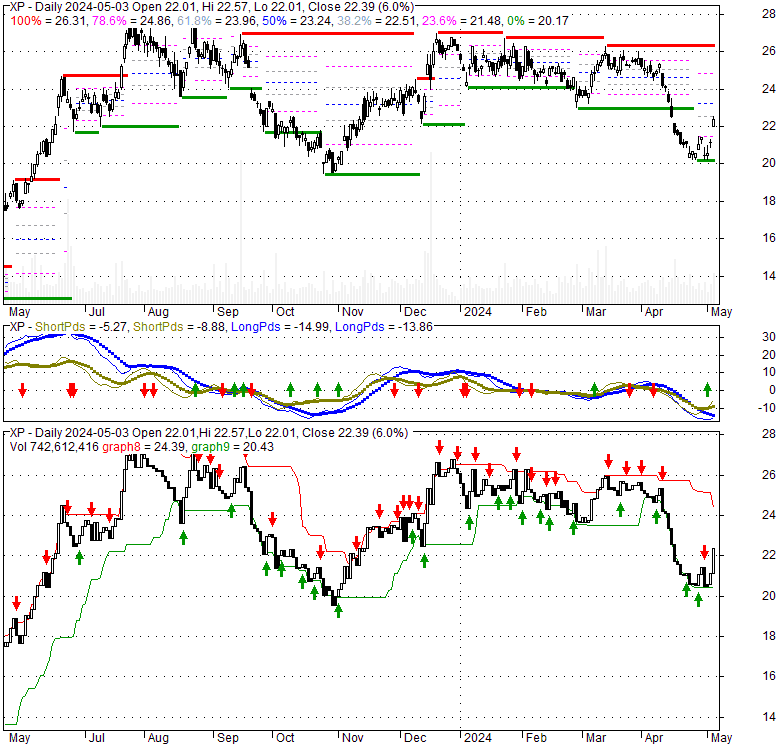
| Price, MAs and Bollinger Bands |
|---|
| Price has closed below its short-term moving average. Short-term moving average is currently below mid-term; and below long-term moving average. From the relationship between price and moving averages: This stock is BEARISH in short-term; and BEARISH in mid-long term.[ XP ] has closed above bottom band by 18.9%. Bollinger Bands are 163.8% wider than normal. The large width of the bands suggest high volatility as compared to its normal range. The bands have been in this wide range for 6 days. This is a sign that the current trend might continue. |
| Company profile |
|---|
| XP Inc. provides financial products and services in Brazil. It offers securities brokerage, private pension plans, commercial, and investment banking products, such as loan operations and transactions in the foreign exchange markets and deposits; product structuring and capital markets services for corporate clients and issuers of fixed income products; advisory services for mass-affluent and institutional clients; and wealth management services for high-net-worth customers and institutional clients. The company also offers Xpeed, an online financial education portal that offers seminars, classes, and learning tools to help teach individuals on topics, such as basics of investing, techniques, and investment strategies, as well as insurance brokerage services. In addition, it operates XP Platform, an open product platform that provides clients to access investment products in the market, including equity and fixed income securities, mutual and hedge funds, private equity, structured products, credit cards, loan operations, life insurance, pension plans, real-estate investment funds, and others. The company was founded in 2001 and is based in São Paulo, Brazil. |
| Stock chart |
|---|
 |
| Stock News |
|---|
|
Wed, 10 Apr 2024 Notable Two Hundred Day Moving Average Cross - XP - Nasdaq Fri, 08 Mar 2024 Is XP Inc (XP) Stock Over or Undervalued? - InvestorsObserver Wed, 28 Feb 2024 XP Inc. (XP) Q4 2023 Earnings Call Transcript - Seeking Alpha Wed, 28 Feb 2024 XP Inc. (NASDAQ:XP) Q4 2023 Earnings Call Transcript - Yahoo Finance Tue, 27 Feb 2024 XP Inc. authorizes share repurchase to offset RSU dilution - Investing.com Tue, 27 Feb 2024 XP Inc. (XP) Announces 2.5M Share Buyback - StreetInsider.com |
| Financial Analysis | |
|---|---|
| Price to Book Value: | Outperform |
| P/BV, a ratio used to compare book value to its current market price, to gauge whether a stock is valued properly. | |
| Price to Earnings: | Outperform |
| PE, the ratio for valuing a company that measures its current share price relative to its earnings per share (EPS). | |
| Discounted cash flow: | Outperform |
| DCF, a valuation method used to estimate the value of an investment based on its expected future cash flows. | |
| Return on Assets: | Outperform |
| ROA, indicates how profitable a company is in relation to its total assets, how efficiently uses assets to generate a profit. | |
| Return on Equity: | Outperform |
| ROE, a measure of financial performance calculated by dividing net income by equity. a gauge of profitability and efficiency. | |
| Debt to Equity: | Outperform |
| evaluate financial leverage, reflects the ability of equity to cover outstanding debts in the event of a business downturn. | |
| Stock Basics & Statistics | |
|---|---|
| Exchange: NASDAQ Global Select | |
| Sector: Financial Services | |
| Industry: Financial - Capital Markets | |
| Shares Out. (M) | 436.78 |
| Shares Float (M) | 405.69 |
| % Held by Insiders | 7.90 |
| % Held by Institutions | 69.76 |
| Shares Short (K) | 18110 |
| Shares Short Prior Month (K) | 11570 |
| Stock Financials | |
|---|---|
| EPS | 1.370 |
| Book Value (p.s.) | 35.460 |
| Profit Margin | 27.37 |
| Operating Margin | 27.18 |
| Return on Assets (ttm) | 1.8 |
| Return on Equity (ttm) | 21.4 |
| Qtrly Rev. Growth | 28.1 |
| Gross Profit (p.s.) | |
| Sales Per Share | 32.602 |
| EBITDA (p.s.) | |
| Qtrly Earnings Growth | 35.50 |
| Operating Cash Flow (M) | 8130.00 |
| Levered Free Cash Flow (M) | |
| Stock Valuation | |
|---|---|
| PE Ratio | 15.07 |
| PEG Ratio | 24.92 |
| Price to Book value | 0.58 |
| Price to Sales | 0.63 |
| Price to Cash Flow | 1.11 |
| Stock Dividends | |
|---|---|
| Dividend | |
| Dividend Yield | |
| Dividend Growth | |


