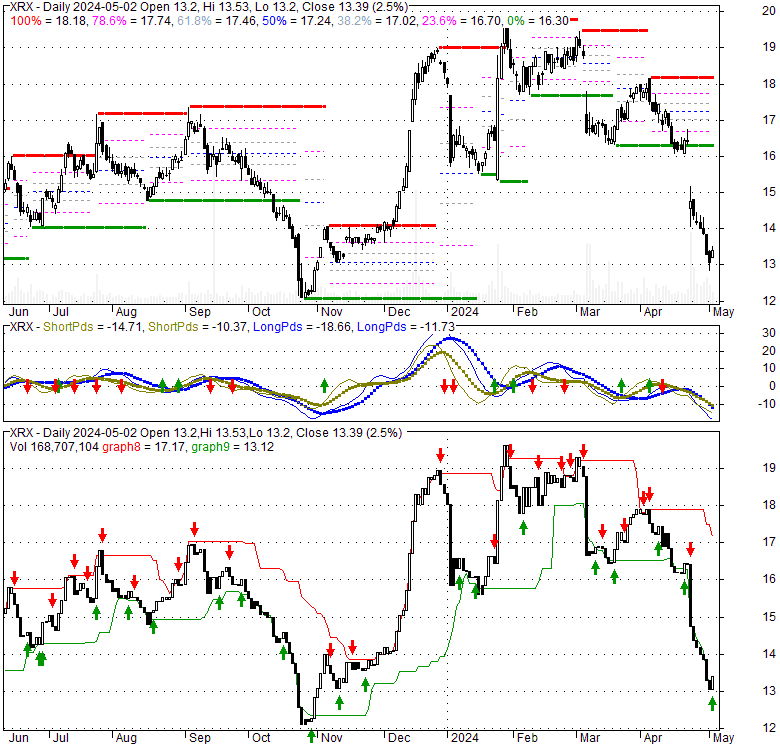
| Xerox Corp (XRX) | |||
|---|---|---|---|
| 16.44 0.26 (1.61%) | 04-19 16:00 | ||
| Open: | 16.09 | Pre. Close: | 16.18 |
| High: | 16.53 | Low: | 16.07 |
| Volume: | 1,370,103 | Market Cap: | 2,042(M) |
| Stock Technical Analysis | |
|---|---|
| Overall: |  |
| Target: | Six months: 20.28 One year: 21.23 |
| Support: | Support1: 16.05 Support2: 13.35 |
| Resistance: | Resistance1: 17.37 Resistance2: 18.18 |
| Pivot: | 17.02 |
| Moving Averages: | MA(5): 16.28 MA(20): 17.16 MA(100): 17.19 MA(250): 15.83 |
| MACD: | MACD(12,26): -0.33 Signal(12,26,9): -0.23 |
| %K %D: | %K(14,3): 10.33 %D(3): 7.49 |
| RSI: | RSI(14): 39.94 |
| 52-Week: | High: 19.78 Low: 12.06 Change(%): 19.5 |
| Average Vol(K): | 3-Month: 2320 10-Days: 2015 |
| Prices Prediction (Update @5:00pm) | ||
|---|---|---|
| If tomorrow: | Open lower | Open higher |
| High: | 16.569 - 16.678 | 16.678 - 16.777 |
| Low: | 15.799 - 15.939 | 15.939 - 16.065 |
| Close: | 16.223 - 16.444 | 16.444 - 16.644 |
| Price, MAs and Bollinger Bands |
|---|
| Price has closed above its short-term moving average. Short-term moving average is currently below mid-term; and below long-term moving average. From the relationship between price and moving averages: This stock is NEUTRAL in short-term; and NEUTRAL in mid-long term.[ XRX ] has closed above bottom band by 25.8%. Bollinger Bands are 22.9% narrower than normal. The current width of the bands does not suggest anything about the future direction or movement of prices. |
| Company profile |
|---|
| Xerox Holdings Corporation, a workplace technology company, designs, develops, and sells document management systems and solutions in the United States, Europe, Canada, and internationally. It offers workplace solutions, including desktop monochrome, and color and multifunction printers; digital printing presses and light production devices, and solutions; and digital services that leverage workflow automation, personalization and communication software, content management solutions, and digitization services. The company also provides graphic communications and production solutions; and IT services, end user computing devices, network infrastructure, communications technology, and a range of managed IT solutions, such as technology product support, professional engineering, and commercial robotic process automation. In addition, it provides FreeFlow a portfolio of software solutions for the automation and integration to the processing of print job comprises file preparation, final production, and electronic publishing; XMPie, a personalization and communication software that support the needs of omni-channel communications customers; DocuShare, a content management platform to capture, store, and share paper and digital content; and CareAR, an enterprise augmented reality business. Further, the company sells paper products and wide-format systems. The company sells its products and services directly to its customers through its direct sales force, as well as through independent agents, dealers, value-added resellers, systems integrators, and e-commerce marketplaces. Xerox Holdings Corporation was founded in 1906 and is headquartered in Norwalk, Connecticut. |
| Stock chart |
|---|
 |
| Financial Analysis | |
|---|---|
| Price to Book Value: | Underperform |
| P/BV, a ratio used to compare book value to its current market price, to gauge whether a stock is valued properly. | |
| Price to Earnings: | Underperform |
| PE, the ratio for valuing a company that measures its current share price relative to its earnings per share (EPS). | |
| Discounted cash flow: | Outperform |
| DCF, a valuation method used to estimate the value of an investment based on its expected future cash flows. | |
| Return on Assets: | Underperform |
| ROA, indicates how profitable a company is in relation to its total assets, how efficiently uses assets to generate a profit. | |
| Return on Equity: | Underperform |
| ROE, a measure of financial performance calculated by dividing net income by equity. a gauge of profitability and efficiency. | |
| Debt to Equity: | Outperform |
| evaluate financial leverage, reflects the ability of equity to cover outstanding debts in the event of a business downturn. | |
| Stock Basics & Statistics | |
|---|---|
| Exchange: NASDAQ Global Select | |
| Sector: Technology | |
| Industry: Information Technology Services | |
| Shares Out. (M) | 124.19 |
| Shares Float (M) | 115.06 |
| % Held by Insiders | 7.25 |
| % Held by Institutions | 88.62 |
| Shares Short (K) | 13450 |
| Shares Short Prior Month (K) | 9970 |
| Stock Financials | |
|---|---|
| EPS | -0.090 |
| Book Value (p.s.) | 20.610 |
| Profit Margin | 0.01 |
| Operating Margin | 4.59 |
| Return on Assets (ttm) | 1.9 |
| Return on Equity (ttm) | |
| Qtrly Rev. Growth | -9.1 |
| Gross Profit (p.s.) | |
| Sales Per Share | 55.480 |
| EBITDA (p.s.) | 4.356 |
| Qtrly Earnings Growth | |
| Operating Cash Flow (M) | 686.00 |
| Levered Free Cash Flow (M) | 602.88 |
| Stock Valuation | |
|---|---|
| PE Ratio | -182.67 |
| PEG Ratio | 1.17 |
| Price to Book value | 0.80 |
| Price to Sales | 0.30 |
| Price to Cash Flow | 2.98 |
| Stock Dividends | |
|---|---|
| Dividend | |
| Dividend Yield | |
| Dividend Growth | |