| Zuora Inc (ZUO) | |||
|---|---|---|---|
| 9.63 0.38 (4.11%) | 04-22 16:01 | ||
| Open: | 9.38 | Pre. Close: | 9.25 |
| High: | 9.66 | Low: | 9.325 |
| Volume: | 2,818,791 | Market Cap: | 1,406(M) |
| Stock Technical Analysis | |
|---|---|
| Overall: |  |
| Target: | Six months: 11.79 One year: 13.77 |
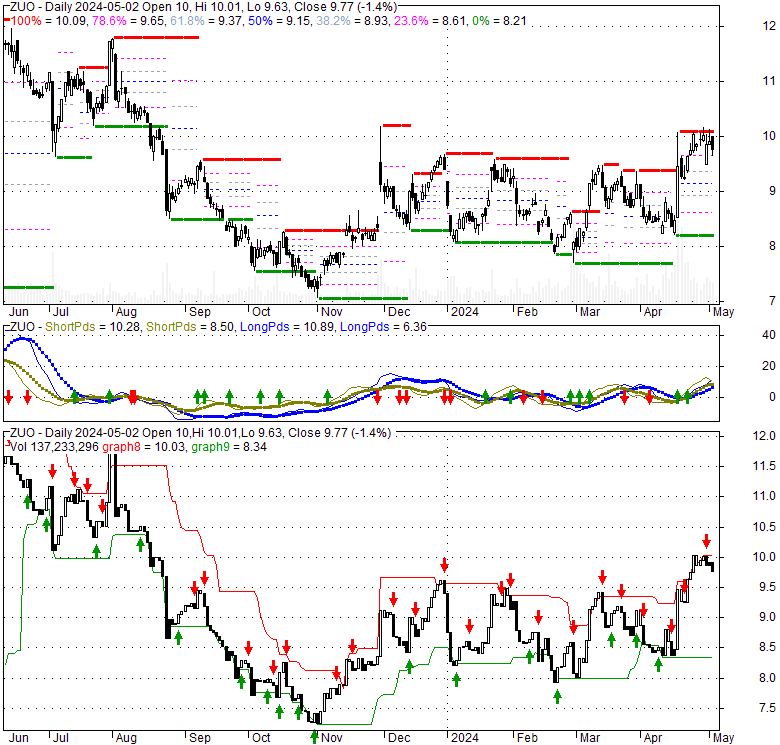
| Support: | Support1: 8.93 Support2: 8.21 |
| Resistance: | Resistance1: 10.09 Resistance2: 11.79 |
| Pivot: | 8.75 |
| Moving Averages: | MA(5): 9.22 MA(20): 8.78 MA(100): 8.77 MA(250): 9.06 |
| MACD: | MACD(12,26): 0.13 Signal(12,26,9): 0.02 |
| %K %D: | %K(14,3): 62.41 %D(3): 56.70 |
| RSI: | RSI(14): 63.75 |
| 52-Week: | High: 12.12 Low: 7.05 Change(%): 14.6 |
| Average Vol(K): | 3-Month: 1673 10-Days: 3241 |
| Prices Prediction (Update @5:00pm) | ||
|---|---|---|
| If tomorrow: | Open lower | Open higher |
| High: | 9.665 - 9.712 | 9.712 - 9.761 |
| Low: | 9.209 - 9.258 | 9.258 - 9.308 |
| Close: | 9.55 - 9.629 | 9.629 - 9.709 |
| Price, MAs and Bollinger Bands |
|---|
| Price has closed above its short-term moving average. Short-term moving average is currently above mid-term; and above long-term moving average. From the relationship between price and moving averages: This stock is BULLISH in short-term; and NEUTRAL in mid-long term.[ ZUO ] has closed Bollinger Bands are 26.3% wider than normal. The current width of the bands does not suggest anything about the future direction or movement of prices. |
| Company profile |
|---|
| Zuora, Inc., together with its subsidiaries, provides cloud-based software on a subscription basis that enables companies in various industries to launch, manage, and transform into a subscription business. The company offers Zuora Central platform that acts as an orchestration engine that allows customers quote-to-revenue operations. Its products include Zuora Billing that helps customers to set payment terms, manage hierarchical billing relationships, consolidate invoicing across multiple subscriptions, and tax transactions; Zuora Revenue, a revenue recognition automation solution; Zuora CPQ for configuring deals, pricing, and quoting in a subscription business; Zuora Collect designed to/ handle the complicated function of payments associated with subscription-based businesses; and Zuora Marketplace. It sells its products through its direct sales force, systems integrators, management consulting firms, resellers, technology, and ecosystem partners. Zuora, Inc. was incorporated in 2006 and is headquartered in Redwood City, California. |
| Stock chart |
|---|
 |
| Stock News |
|---|
|
Sun, 21 Apr 2024 What Makes Zuora (ZUO) a New Buy Stock - Yahoo Movies UK Sat, 20 Apr 2024 Is Now An Opportune Moment To Examine Zuora, Inc. (NYSE:ZUO)? - Simply Wall St Fri, 19 Apr 2024 Chief Revenue Officer Robert Traube Sells 11294 Shares of Zuora Inc (ZUO) - GuruFocus.com Wed, 17 Apr 2024 Zuora (ZUO) Explores Options, Including Sale - Bloomberg Wed, 17 Apr 2024 Zuora stock jumps amid reports of takeover interest - Seeking Alpha Tue, 16 Apr 2024 Zuora (ZUO) Rises Higher Than Market: Key Facts - Yahoo Finance |
| Financial Analysis | |
|---|---|
| Price to Book Value: | Outperform |
| P/BV, a ratio used to compare book value to its current market price, to gauge whether a stock is valued properly. | |
| Price to Earnings: | Underperform |
| PE, the ratio for valuing a company that measures its current share price relative to its earnings per share (EPS). | |
| Discounted cash flow: | Underperform |
| DCF, a valuation method used to estimate the value of an investment based on its expected future cash flows. | |
| Return on Assets: | Underperform |
| ROA, indicates how profitable a company is in relation to its total assets, how efficiently uses assets to generate a profit. | |
| Return on Equity: | Underperform |
| ROE, a measure of financial performance calculated by dividing net income by equity. a gauge of profitability and efficiency. | |
| Debt to Equity: | Outperform |
| evaluate financial leverage, reflects the ability of equity to cover outstanding debts in the event of a business downturn. | |
| Stock Basics & Statistics | |
|---|---|
| Exchange: New York Stock Exchange | |
| Sector: Technology | |
| Industry: Software - Infrastructure | |
| Shares Out. (M) | 137.80 |
| Shares Float (M) | 136.47 |
| % Held by Insiders | 0.91 |
| % Held by Institutions | 80.98 |
| Shares Short (K) | 5630 |
| Shares Short Prior Month (K) | 5160 |
| Stock Financials | |
|---|---|
| EPS | -0.490 |
| Book Value (p.s.) | 0.920 |
| Profit Margin | -15.80 |
| Operating Margin | -7.95 |
| Return on Assets (ttm) | -4.7 |
| Return on Equity (ttm) | -59.1 |
| Qtrly Rev. Growth | 7.4 |
| Gross Profit (p.s.) | |
| Sales Per Share | 3.133 |
| EBITDA (p.s.) | -0.271 |
| Qtrly Earnings Growth | |
| Operating Cash Flow (M) | -18.77 |
| Levered Free Cash Flow (M) | 18.50 |
| Stock Valuation | |
|---|---|
| PE Ratio | -19.65 |
| PEG Ratio | |
| Price to Book value | 10.47 |
| Price to Sales | 3.07 |
| Price to Cash Flow | -70.70 |
| Stock Dividends | |
|---|---|
| Dividend | |
| Dividend Yield | |
| Dividend Growth | |