| Atlas Air Ww (AAWW) | |||
|---|---|---|---|
| 102.48 0.02 (0.02%) | 03-17 16:00 | ||
| Open: | 102.48 | Pre. Close: | 102.46 |
| High: | 102.5 | Low: | 102.47 |
| Volume: | 1,527,211 | Market Cap: | 2,934(M) |
| Stock Technical Analysis | |
|---|---|
| Overall: |  |
| Target: | Six months: 119.72 One year: 139.83 |
| Support: | Support1: 99.56 Support2: 97.75 |
| Resistance: | Resistance1: 102.50 Resistance2: 119.72 |
| Pivot: | 101.23 |
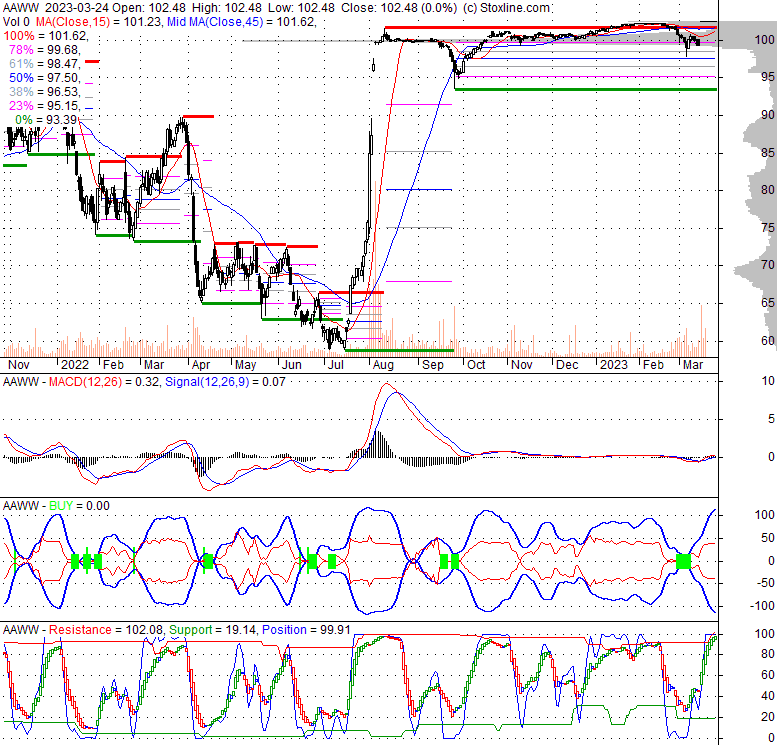
| Moving Averages: | MA(5): 102.48 MA(20): 101.07 MA(100): 101.16 MA(250): 89.07 |
| MACD: | MACD(12,26): 0.32 Signal(12,26,9): 0.07 |
| %K %D: | %K(14,3): 99.58 %D(3): 99.58 |
| RSI: | RSI(14): 62.07 |
| 52-Week: | High: 102.5 Low: 58.7 Change(%): 16.0 |
| Average Vol(K): | 3-Month: 501 10-Days: 671 |
| Prices Prediction (Update @5:00pm) | ||
|---|---|---|
| If tomorrow: | Open lower | Open higher |
| High: | 102.719 - 103.225 | 103.225 - 103.635 |
| Low: | 101.045 - 101.751 | 101.751 - 102.323 |
| Close: | 101.503 - 102.559 | 102.559 - 103.416 |
| Price, MAs and Bollinger Bands |
|---|
| Price has closed below its short-term moving average. Short-term moving average is currently above mid-term; and above long-term moving average. From the relationship between price and moving averages: This stock is NEUTRAL in short-term; and BULLISH in mid-long term.[ AAWW ] has closed below upper band by 27.2%. Bollinger Bands are 242.9% wider than normal. The large width of the bands suggest high volatility as compared to its normal range. The bands have been in this wide range for 15 days. This is a sign that the current trend might continue. |
| Company profile |
|---|
| Atlas Air Worldwide Holdings, Inc., through its subsidiaries, provides outsourced aircraft and aviation operating services. It operates through two segments, Airline Operations and Dry Leasing. The company offers outsourced cargo and passenger aircraft operating solutions, including contractual service arrangements, such as the provision of aircraft; and value-added services, including crew, maintenance, and insurance to aircraft and other customers. It also provides cargo and passenger aircraft charter services to the U.S. Military Air Mobility Command, charter brokers, freight forwarders, direct shippers, airlines, manufacturers, sports teams and fans, and private charter customers; and cargo and passenger aircraft and engines dry leasing services. In addition, the company offers administrative and management support services, and flight simulator training services. It also serves express delivery providers, e-commerce retailers, and airlines. The company has operations in Africa, Asia, Australia, Europe, the Middle East, North America, and South America. Atlas Air Worldwide Holdings, Inc. was founded in 1992 and is headquartered in Purchase, New York. |
| Stock chart |
|---|
 |
| Stock News |
|---|
|
Fri, 17 Mar 2023 J.F. Lehman & Company Acquires Atlas Air Worldwide In Partnership With Apollo and Hill City Capital - PR Newswire Wed, 01 Feb 2023 Boeing, Atlas Air celebrate delivery of final 747 - Skies Magazine Mon, 28 Nov 2022 African passenger airline adds 1st all-cargo aircraft - FreightWaves Fri, 29 Mar 2019 Amazon moves into 737 freighter operations under lease with Atlas Air - FreightWaves Wed, 20 Feb 2019 Atlas Air posts solid quarter, full-year results; tees up bullish 2019 outlook - FreightWaves Thu, 02 May 2024 |
| Financial Analysis | |
|---|---|
| Price to Book Value: | Outperform |
| P/BV, a ratio used to compare book value to its current market price, to gauge whether a stock is valued properly. | |
| Price to Earnings: | Outperform |
| PE, the ratio for valuing a company that measures its current share price relative to its earnings per share (EPS). | |
| Discounted cash flow: | Outperform |
| DCF, a valuation method used to estimate the value of an investment based on its expected future cash flows. | |
| Return on Assets: | Neutral |
| ROA, indicates how profitable a company is in relation to its total assets, how efficiently uses assets to generate a profit. | |
| Return on Equity: | Neutral |
| ROE, a measure of financial performance calculated by dividing net income by equity. a gauge of profitability and efficiency. | |
| Debt to Equity: | Outperform |
| evaluate financial leverage, reflects the ability of equity to cover outstanding debts in the event of a business downturn. | |
| Stock Basics & Statistics | |
|---|---|
| Exchange: NASDAQ Global Select | |
| Sector: Industrials | |
| Industry: Airlines, Airports & Air Services | |
| Shares Out. (M) | 28.63 |
| Shares Float (M) | 26.67 |
| % Held by Insiders | 1.40 |
| % Held by Institutions | 114.02 |
| Shares Short (K) | 2910 |
| Shares Short Prior Month (K) | 3140 |
| Stock Financials | |
|---|---|
| EPS | 10.530 |
| Book Value (p.s.) | 107.380 |
| Profit Margin | 7.82 |
| Operating Margin | 12.12 |
| Return on Assets (ttm) | 5.3 |
| Return on Equity (ttm) | 12.1 |
| Qtrly Rev. Growth | 3.8 |
| Gross Profit (p.s.) | 43.660 |
| Sales Per Share | 158.924 |
| EBITDA (p.s.) | 29.993 |
| Qtrly Earnings Growth | -33.40 |
| Operating Cash Flow (M) | 837.74 |
| Levered Free Cash Flow (M) | -167.77 |
| Stock Valuation | |
|---|---|
| PE Ratio | 9.73 |
| PEG Ratio | 0.73 |
| Price to Book value | 0.95 |
| Price to Sales | 0.64 |
| Price to Cash Flow | 3.50 |
| Stock Dividends | |
|---|---|
| Dividend | |
| Dividend Yield | |
| Dividend Growth | |