| C3.Ai Inc Cl A (AI) | |||
|---|---|---|---|
| 22.16 -0.19 (-0.85%) | 04-25 16:00 | ||
| Open: | 21.5 | Pre. Close: | 22.35 |
| High: | 22.19 | Low: | 21.351 |
| Volume: | 3,004,134 | Market Cap: | 2,627(M) |
| Stock Technical Analysis | |
|---|---|
| Overall: |  |
| Target: | Six months: 30.29 One year: 34.41 |
| Support: | Support1: 20.23 Support2: 16.83 |
| Resistance: | Resistance1: 25.93 Resistance2: 29.46 |
| Pivot: | 22.45 |
| Moving Averages: | MA(5): 21.83 MA(20): 23.31 MA(100): 27.43 MA(250): 29.36 |
| MACD: | MACD(12,26): -1.63 Signal(12,26,9): -1.76 |
| %K %D: | %K(14,3): 35.91 %D(3): 29.89 |
| RSI: | RSI(14): 36.25 |
| 52-Week: | High: 48.87 Low: 16.79 Change(%): 26.0 |
| Average Vol(K): | 3-Month: 7483 10-Days: 5072 |
| Prices Prediction (Update @5:00pm) | ||
|---|---|---|
| If tomorrow: | Open lower | Open higher |
| High: | 22.203 - 22.316 | 22.316 - 22.403 |
| Low: | 21.09 - 21.207 | 21.207 - 21.297 |
| Close: | 21.969 - 22.171 | 22.171 - 22.326 |
| Price, MAs and Bollinger Bands |
|---|
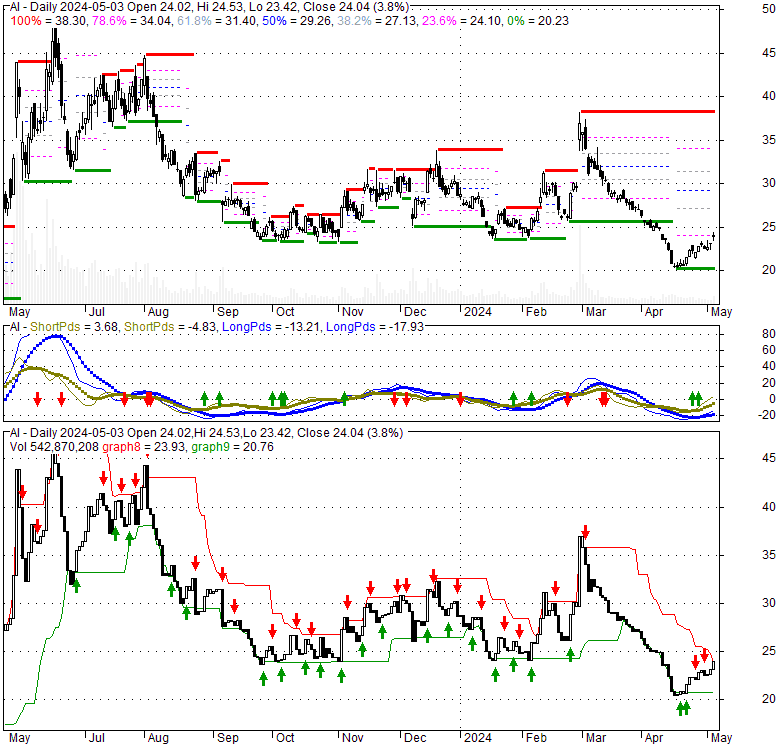
| Price has closed above its short-term moving average. Short-term moving average is currently below mid-term; and below long-term moving average. From the relationship between price and moving averages: This stock is NEUTRAL in short-term; and BEARISH in mid-long term.[ AI ] has closed above bottom band by 45.5%. Bollinger Bands are 4% narrower than normal. The current width of the bands does not suggest anything about the future direction or movement of prices. |
| Company profile |
|---|
| C3.ai, Inc. operates as an enterprise artificial intelligence (AI) software company in North America, Europe, the Middle East, Africa, the Asia Pacific, and internationally. It provides C3 AI application platform, an application development and runtime environment that enables customers to design, develop, and deploy enterprise AI applications; C3 AI Ex Machina to for analysis-ready data; C3 AI CRM, an industry specific customer relationship management solution; and C3 AI Data Vision that visualizes, understands, and leverages the relationships between data entities. It also offers C3 AI applications, including C3 AI Inventory Optimization, a solution to optimize raw material, in-process, and finished goods inventory levels; C3 AI Supply Network Risk, which provides visibility into risks of disruption throughout the supply chain operations; C3 AI Customer Churn Management, which enables account executives and relationship managers to monitor customer satisfaction, as well as to prevent customer churn with AI-based and human-interpretable predictions and warning; C3 AI Production Schedule Optimization, a solution for scheduling production; C3 AI Predictive Maintenance, which provides insight into asset risk to maintenance planners and equipment operators; C3 AI Fraud Detection solution that identify revenue leakage or maintenance and safety issues; and C3 AI Energy Management solution. In addition, it offers integrated turnkey enterprise AI applications for oil and gas, chemicals, utilities, manufacturing, financial services, defense, intelligence, aerospace, healthcare, and telecommunications market segments. It has strategic partnerships with Baker Hughes in the areas of oil and gas market; FIS in the areas of financial services market; Raytheon; and AWS, Intel, Google, and Microsoft. The company was formerly known as C3 IoT, Inc. and changed its name to C3.ai, Inc. in June 2019. C3.ai, Inc. was incorporated in 2009 and is headquartered in Redwood City, California. |
| Stock chart |
|---|
 |
| Financial Analysis | |
|---|---|
| Price to Book Value: | Outperform |
| P/BV, a ratio used to compare book value to its current market price, to gauge whether a stock is valued properly. | |
| Price to Earnings: | Underperform |
| PE, the ratio for valuing a company that measures its current share price relative to its earnings per share (EPS). | |
| Discounted cash flow: | Underperform |
| DCF, a valuation method used to estimate the value of an investment based on its expected future cash flows. | |
| Return on Assets: | Underperform |
| ROA, indicates how profitable a company is in relation to its total assets, how efficiently uses assets to generate a profit. | |
| Return on Equity: | Underperform |
| ROE, a measure of financial performance calculated by dividing net income by equity. a gauge of profitability and efficiency. | |
| Debt to Equity: | Underperform |
| evaluate financial leverage, reflects the ability of equity to cover outstanding debts in the event of a business downturn. | |
| Stock Basics & Statistics | |
|---|---|
| Exchange: New York Stock Exchange | |
| Sector: Technology | |
| Industry: Information Technology Services | |
| Shares Out. (M) | 118.55 |
| Shares Float (M) | 105.88 |
| % Held by Insiders | 9.55 |
| % Held by Institutions | 46.89 |
| Shares Short (K) | 31840 |
| Shares Short Prior Month (K) | 34330 |
| Stock Financials | |
|---|---|
| EPS | -2.330 |
| Book Value (p.s.) | 7.380 |
| Profit Margin | -91.67 |
| Operating Margin | -105.29 |
| Return on Assets (ttm) | -17.9 |
| Return on Equity (ttm) | -29.5 |
| Qtrly Rev. Growth | 17.6 |
| Gross Profit (p.s.) | |
| Sales Per Share | 2.500 |
| EBITDA (p.s.) | -2.515 |
| Qtrly Earnings Growth | |
| Operating Cash Flow (M) | -56.65 |
| Levered Free Cash Flow (M) | -51.12 |
| Stock Valuation | |
|---|---|
| PE Ratio | -9.51 |
| PEG Ratio | -0.62 |
| Price to Book value | 3.00 |
| Price to Sales | 8.86 |
| Price to Cash Flow | -46.37 |
| Stock Dividends | |
|---|---|
| Dividend | |
| Dividend Yield | |
| Dividend Growth | |