| Antero Midstream Corp (AM) | |||
|---|---|---|---|
| 14.23 0.21 (1.5%) | 04-25 16:00 | ||
| Open: | 13.94 | Pre. Close: | 14.02 |
| High: | 14.275 | Low: | 13.84 |
| Volume: | 3,144,515 | Market Cap: | 6,827(M) |
| Stock Technical Analysis | |
|---|---|
| Overall: |  |
| Target: | Six months: 16.96 One year: 19.81 |
| Support: | Support1: 13.86 Support2: 13.45 |
| Resistance: | Resistance1: 14.52 Resistance2: 16.96 |
| Pivot: | 13.97 |
| Moving Averages: | MA(5): 14.02 MA(20): 14.04 MA(100): 13.02 MA(250): 12.24 |
| MACD: | MACD(12,26): 0.10 Signal(12,26,9): 0.11 |
| %K %D: | %K(14,3): 61.75 %D(3): 52.98 |
| RSI: | RSI(14): 63.08 |
| 52-Week: | High: 14.52 Low: 9.69 Change(%): 37.6 |
| Average Vol(K): | 3-Month: 2755 10-Days: 2463 |
| Prices Prediction (Update @5:00pm) | ||
|---|---|---|
| If tomorrow: | Open lower | Open higher |
| High: | 14.288 - 14.341 | 14.341 - 14.383 |
| Low: | 13.698 - 13.764 | 13.764 - 13.817 |
| Close: | 14.129 - 14.233 | 14.233 - 14.316 |
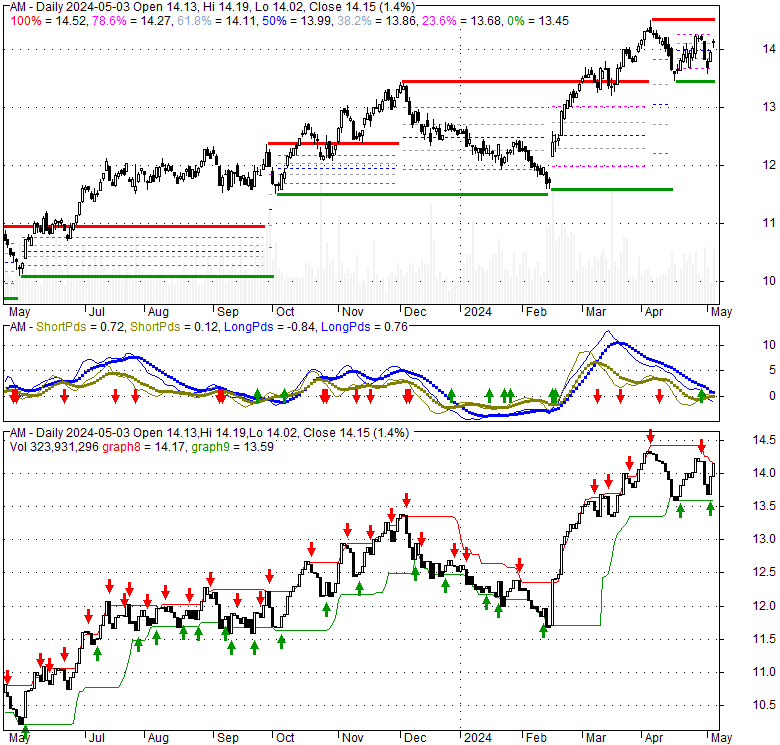
| Price, MAs and Bollinger Bands |
|---|
| Price has closed above its short-term moving average. Short-term moving average is currently above mid-term; and above long-term moving average. From the relationship between price and moving averages: This stock is BULLISH in short-term; and BULLISH in mid-long term.[ AM ] has closed below upper band by 19.9%. Bollinger Bands are 7.2% narrower than normal. The current width of the bands does not suggest anything about the future direction or movement of prices. |
| Company profile |
|---|
| Antero Midstream Corporation owns, operates, and develops midstream energy infrastructure. It operates through Gathering and Processing, and Water Handling segments. The Gathering and Processing segment includes a network of gathering pipelines and compressor stations that collects and processes production from Antero Resources' wells in West Virginia and Ohio. The Water Handling segment delivers fresh water; and offers pumping stations, water storage, and blending facilities. The company was incorporated in 2013 and is headquartered in Denver, Colorado. |
| Stock chart |
|---|
 |
| Financial Analysis | |
|---|---|
| Price to Book Value: | Outperform |
| P/BV, a ratio used to compare book value to its current market price, to gauge whether a stock is valued properly. | |
| Price to Earnings: | Outperform |
| PE, the ratio for valuing a company that measures its current share price relative to its earnings per share (EPS). | |
| Discounted cash flow: | Outperform |
| DCF, a valuation method used to estimate the value of an investment based on its expected future cash flows. | |
| Return on Assets: | Outperform |
| ROA, indicates how profitable a company is in relation to its total assets, how efficiently uses assets to generate a profit. | |
| Return on Equity: | Outperform |
| ROE, a measure of financial performance calculated by dividing net income by equity. a gauge of profitability and efficiency. | |
| Debt to Equity: | Outperform |
| evaluate financial leverage, reflects the ability of equity to cover outstanding debts in the event of a business downturn. | |
| Stock Basics & Statistics | |
|---|---|
| Exchange: New York Stock Exchange | |
| Sector: Energy | |
| Industry: Oil & Gas Midstream | |
| Shares Out. (M) | 479.74 |
| Shares Float (M) | 337.40 |
| % Held by Insiders | 29.61 |
| % Held by Institutions | 54.54 |
| Shares Short (K) | 13700 |
| Shares Short Prior Month (K) | 13240 |
| Stock Financials | |
|---|---|
| EPS | 0.770 |
| Book Value (p.s.) | 4.490 |
| Profit Margin | 33.42 |
| Operating Margin | 56.08 |
| Return on Assets (ttm) | 6.7 |
| Return on Equity (ttm) | 17.1 |
| Qtrly Rev. Growth | 7.2 |
| Gross Profit (p.s.) | |
| Sales Per Share | 2.314 |
| EBITDA (p.s.) | 1.720 |
| Qtrly Earnings Growth | 23.20 |
| Operating Cash Flow (M) | 779.06 |
| Levered Free Cash Flow (M) | 303.26 |
| Stock Valuation | |
|---|---|
| PE Ratio | 18.48 |
| PEG Ratio | 1.40 |
| Price to Book value | 3.17 |
| Price to Sales | 6.15 |
| Price to Cash Flow | 8.76 |
| Stock Dividends | |
|---|---|
| Dividend | |
| Dividend Yield | |
| Dividend Growth | |


