| Adv Micro Devices (AMD) | |||
|---|---|---|---|
| 153.76 2.02 (1.33%) | 04-25 16:00 | ||
| Open: | 149.147 | Pre. Close: | 151.74 |
| High: | 155.14 | Low: | 146.75 |
| Volume: | 40,984,305 | Market Cap: | 248,444(M) |
| Stock Technical Analysis | |
|---|---|
| Overall: |  |
| Target: | Six months: 200.31 One year: 219.22 |
| Support: | Support1: 145.30 Support2: 120.89 |
| Resistance: | Resistance1: 171.50 Resistance2: 187.69 |
| Pivot: | 159.86 |
| Moving Averages: | MA(5): 150.61 MA(20): 164.35 MA(100): 164.70 MA(250): 131.38 |
| MACD: | MACD(12,26): -8.01 Signal(12,26,9): -7.08 |
| %K %D: | %K(14,3): 22.15 %D(3): 15.71 |
| RSI: | RSI(14): 37.78 |
| 52-Week: | High: 227.3 Low: 81.02 Change(%): 75.8 |
| Average Vol(K): | 3-Month: 67113 10-Days: 55882 |
| Prices Prediction (Update @5:00pm) | ||
|---|---|---|
| If tomorrow: | Open lower | Open higher |
| High: | 155.253 - 155.989 | 155.989 - 156.681 |
| Low: | 144.916 - 145.741 | 145.741 - 146.515 |
| Close: | 152.372 - 153.701 | 153.701 - 154.949 |
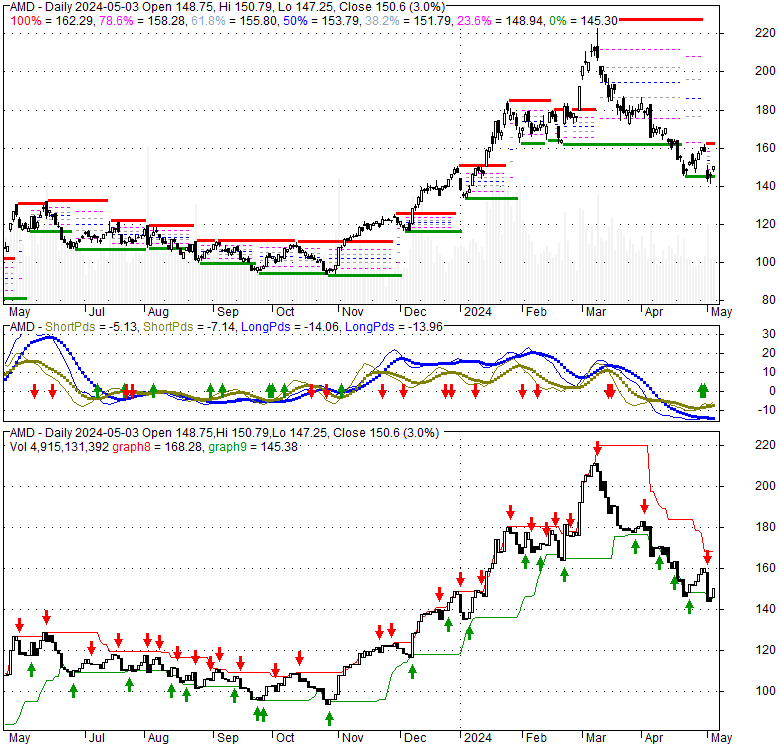
| Price, MAs and Bollinger Bands |
|---|
| Price has closed above its short-term moving average. Short-term moving average is currently below mid-term; and below long-term moving average. From the relationship between price and moving averages: This stock is NEUTRAL in short-term; and NEUTRAL in mid-long term.[ AMD ] has closed above bottom band by 31.7%. Bollinger Bands are 8.6% wider than normal. The current width of the bands does not suggest anything about the future direction or movement of prices. |
| Company profile |
|---|
| Advanced Micro Devices, Inc. operates as a semiconductor company worldwide. The company operates in two segments, Computing and Graphics; and Enterprise, Embedded and Semi-Custom. Its products include x86 microprocessors as an accelerated processing unit, chipsets, discrete and integrated graphics processing units (GPUs), data center and professional GPUs, and development services; and server and embedded processors, and semi-custom System-on-Chip (SoC) products, development services, and technology for game consoles. The company provides processors for desktop and notebook personal computers under the AMD Ryzen, AMD Ryzen PRO, Ryzen Threadripper, Ryzen Threadripper PRO, AMD Athlon, AMD Athlon PRO, AMD FX, AMD A-Series, and AMD PRO A-Series processors brands; discrete GPUs for desktop and notebook PCs under the AMD Radeon graphics, AMD Embedded Radeon graphics brands; and professional graphics products under the AMD Radeon Pro and AMD FirePro graphics brands. It also offers Radeon Instinct, Radeon PRO V-series, and AMD Instinct accelerators for servers; chipsets under the AMD trademark; microprocessors for servers under the AMD EPYC; embedded processor solutions under the AMD Athlon, AMD Geode, AMD Ryzen, AMD EPYC, AMD R-Series, and G-Series processors brands; and customer-specific solutions based on AMD CPU, GPU, and multi-media technologies, as well as semi-custom SoC products. It serves original equipment manufacturers, public cloud service providers, original design manufacturers, system integrators, independent distributors, online retailers, and add-in-board manufacturers through its direct sales force, independent distributors, and sales representatives. The company was incorporated in 1969 and is headquartered in Santa Clara, California. |
| Stock chart |
|---|
 |
| Financial Analysis | |
|---|---|
| Price to Book Value: | Outperform |
| P/BV, a ratio used to compare book value to its current market price, to gauge whether a stock is valued properly. | |
| Price to Earnings: | Outperform |
| PE, the ratio for valuing a company that measures its current share price relative to its earnings per share (EPS). | |
| Discounted cash flow: | Neutral |
| DCF, a valuation method used to estimate the value of an investment based on its expected future cash flows. | |
| Return on Assets: | Outperform |
| ROA, indicates how profitable a company is in relation to its total assets, how efficiently uses assets to generate a profit. | |
| Return on Equity: | Neutral |
| ROE, a measure of financial performance calculated by dividing net income by equity. a gauge of profitability and efficiency. | |
| Debt to Equity: | Neutral |
| evaluate financial leverage, reflects the ability of equity to cover outstanding debts in the event of a business downturn. | |
| Stock Basics & Statistics | |
|---|---|
| Exchange: NASDAQ Global Select | |
| Sector: Technology | |
| Industry: Semiconductors | |
| Shares Out. (M) | |
| Shares Float (M) | 1620.00 |
| % Held by Insiders | 1600000000.00 |
| % Held by Institutions | 0.47 |
| Shares Short (K) | 34380 |
| Shares Short Prior Month (K) | |
| Stock Financials | |
|---|---|
| EPS | 0.530 |
| Book Value (p.s.) | 869.300 |
| Profit Margin | 3.77 |
| Operating Margin | 5.54 |
| Return on Assets (ttm) | 0.4 |
| Return on Equity (ttm) | 1.5 |
| Qtrly Rev. Growth | 10.2 |
| Gross Profit (p.s.) | |
| Sales Per Share | 13914110976.000 |
| EBITDA (p.s.) | 2361963264.000 |
| Qtrly Earnings Growth | 4.00 |
| Operating Cash Flow (M) | |
| Levered Free Cash Flow (M) | 1670.00 |
| Stock Valuation | |
|---|---|
| PE Ratio | 290.11 |
| PEG Ratio | 1.94 |
| Price to Book value | 0.18 |
| Price to Sales | |
| Price to Cash Flow | 7.25 |
| Stock Dividends | |
|---|---|
| Dividend | |
| Dividend Yield | |
| Dividend Growth | 32850000.000 |


