| Amneal Pharmaceuticals Inc (AMRX) | |||
|---|---|---|---|
| 5.87 -0.03 (-0.51%) | 04-26 16:00 | ||
| Open: | 5.9 | Pre. Close: | 5.9 |
| High: | 5.975 | Low: | 5.84 |
| Volume: | 936,292 | Market Cap: | 1,811(M) |
| Stock Technical Analysis | |
|---|---|
| Overall: |  |
| Target: | Six months: 7.39 One year: 8.64 |
| Support: | Support1: 5.62 Support2: 5.18 |
| Resistance: | Resistance1: 6.33 Resistance2: 7.39 |
| Pivot: | 5.63 |
| Moving Averages: | MA(5): 5.72 MA(20): 5.72 MA(100): 5.58 MA(250): 4.31 |
| MACD: | MACD(12,26): -0.01 Signal(12,26,9): -0.04 |
| %K %D: | %K(14,3): 66.09 %D(3): 51.88 |
| RSI: | RSI(14): 54.79 |
| 52-Week: | High: 6.46 Low: 1.74 Change(%): 204.1 |
| Average Vol(K): | 3-Month: 1563 10-Days: 1576 |
| Prices Prediction (Update @5:00pm) | ||
|---|---|---|
| If tomorrow: | Open lower | Open higher |
| High: | 5.973 - 6.013 | 6.013 - 6.046 |
| Low: | 5.763 - 5.802 | 5.802 - 5.835 |
| Close: | 5.813 - 5.876 | 5.876 - 5.929 |
| Price, MAs and Bollinger Bands |
|---|
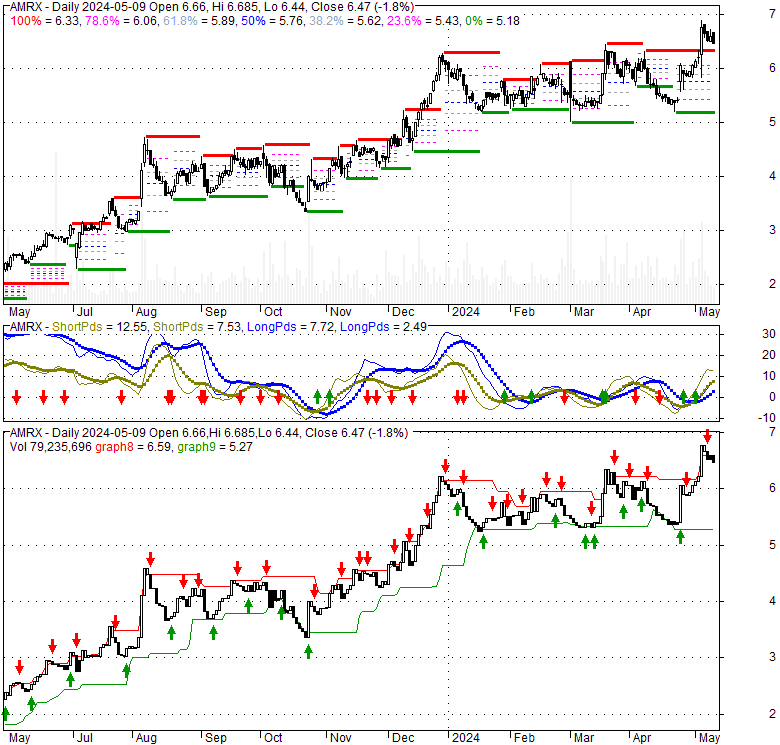
| Price has closed above its short-term moving average. Short-term moving average is currently above mid-term; and above long-term moving average. From the relationship between price and moving averages: This stock is BULLISH in short-term; and BULLISH in mid-long term.[ AMRX ] has closed below upper band by 23.8%. Bollinger Bands are 3.2% narrower than normal. The current width of the bands does not suggest anything about the future direction or movement of prices. |
| Company profile |
|---|
| Amneal Pharmaceuticals, Inc., together with its subsidiaries, develops, licenses, manufactures, markets, and distributes generic and specialty pharmaceutical products for various dosage forms and therapeutic areas. The company operates through three segments: Generics, Specialty, and AvKARE. The Generics segment develops, manufactures, and commercializes complex oral solids, injectables, ophthalmics, liquids, topicals, softgels, inhalation products, and transdermals across a range of therapeutic categories. The Specialty segment is involved in the development, promotion, distribution, and sale of branded pharmaceutical products with focus on central nervous system disorders, endocrinology, parasitic infections, and other therapeutic areas. It also offers Emverm, a chewable tablet for the treatment of pinworm, whipworm, common roundworm, common hookworm, and American hookworm in single or mixed infections; Rytary to treat Parkinson's disease; and Unithroid for the treatment of hypothyroidism. The AvKARE segment provides pharmaceuticals, medical and surgical products, and services primarily to governmental agencies, the Department of Defense, and the Department of Veterans Affairs. It is also involved in the wholesale distribution of bottle and unit dose pharmaceuticals under the AvKARE and AvPAK names, as well as medical and surgical products; and packaging and wholesale distribution of pharmaceuticals and vitamins to its retail and institutional customers. The company sells its products through wholesalers, distributors, hospitals, chain pharmacies, and individual pharmacies. It operates in the United States, India, Ireland, and internationally. The company was formerly known as Atlas Holdings, Inc. and changed its name to Amneal Pharmaceuticals, Inc. in 2018. Amneal Pharmaceuticals, Inc. was founded in 2002 and is headquartered in Bridgewater, New Jersey. |
| Stock chart |
|---|
 |
| Financial Analysis | |
|---|---|
| Price to Book Value: | Outperform |
| P/BV, a ratio used to compare book value to its current market price, to gauge whether a stock is valued properly. | |
| Price to Earnings: | Underperform |
| PE, the ratio for valuing a company that measures its current share price relative to its earnings per share (EPS). | |
| Discounted cash flow: | Outperform |
| DCF, a valuation method used to estimate the value of an investment based on its expected future cash flows. | |
| Return on Assets: | Underperform |
| ROA, indicates how profitable a company is in relation to its total assets, how efficiently uses assets to generate a profit. | |
| Return on Equity: | Underperform |
| ROE, a measure of financial performance calculated by dividing net income by equity. a gauge of profitability and efficiency. | |
| Debt to Equity: | Outperform |
| evaluate financial leverage, reflects the ability of equity to cover outstanding debts in the event of a business downturn. | |
| Stock Basics & Statistics | |
|---|---|
| Exchange: New York Stock Exchange | |
| Sector: Healthcare | |
| Industry: Drug Manufacturers - Specialty & Generic | |
| Shares Out. (M) | 308.55 |
| Shares Float (M) | 123.43 |
| % Held by Insiders | 59.78 |
| % Held by Institutions | 29.04 |
| Shares Short (K) | 2400 |
| Shares Short Prior Month (K) | 1830 |
| Stock Financials | |
|---|---|
| EPS | -0.480 |
| Book Value (p.s.) | 0.060 |
| Profit Margin | -3.51 |
| Operating Margin | 13.19 |
| Return on Assets (ttm) | 4.7 |
| Return on Equity (ttm) | -36.1 |
| Qtrly Rev. Growth | 1.2 |
| Gross Profit (p.s.) | |
| Sales Per Share | 7.746 |
| EBITDA (p.s.) | 1.623 |
| Qtrly Earnings Growth | |
| Operating Cash Flow (M) | 345.58 |
| Levered Free Cash Flow (M) | 303.90 |
| Stock Valuation | |
|---|---|
| PE Ratio | -12.23 |
| PEG Ratio | -6.16 |
| Price to Book value | 97.83 |
| Price to Sales | 0.76 |
| Price to Cash Flow | 5.24 |
| Stock Dividends | |
|---|---|
| Dividend | |
| Dividend Yield | |
| Dividend Growth | |