| Api Group Corp (APG) | |||
|---|---|---|---|
| 37.68 0.17 (0.45%) | 04-25 16:00 | ||
| Open: | 37.24 | Pre. Close: | 37.51 |
| High: | 37.76 | Low: | 36.8 |
| Volume: | 1,431,125 | Market Cap: | 10,424(M) |
| Stock Technical Analysis | |
|---|---|
| Overall: |  |
| Target: | Six months: 45.19 One year: 46.70 |
| Support: | Support1: 36.60 Support2: 30.45 |
| Resistance: | Resistance1: 38.69 Resistance2: 39.98 |
| Pivot: | 38.39 |
| Moving Averages: | MA(5): 37.56 MA(20): 38.52 MA(100): 35.13 MA(250): 29.87 |
| MACD: | MACD(12,26): -0.10 Signal(12,26,9): 0.13 |
| %K %D: | %K(14,3): 37.48 %D(3): 32.64 |
| RSI: | RSI(14): 47.15 |
| 52-Week: | High: 39.98 Low: 21.65 Change(%): 67.6 |
| Average Vol(K): | 3-Month: 1586 10-Days: 2495 |
| Prices Prediction (Update @5:00pm) | ||
|---|---|---|
| If tomorrow: | Open lower | Open higher |
| High: | 37.788 - 37.967 | 37.967 - 38.135 |
| Low: | 36.34 - 36.547 | 36.547 - 36.741 |
| Close: | 37.34 - 37.665 | 37.665 - 37.971 |
| Price, MAs and Bollinger Bands |
|---|
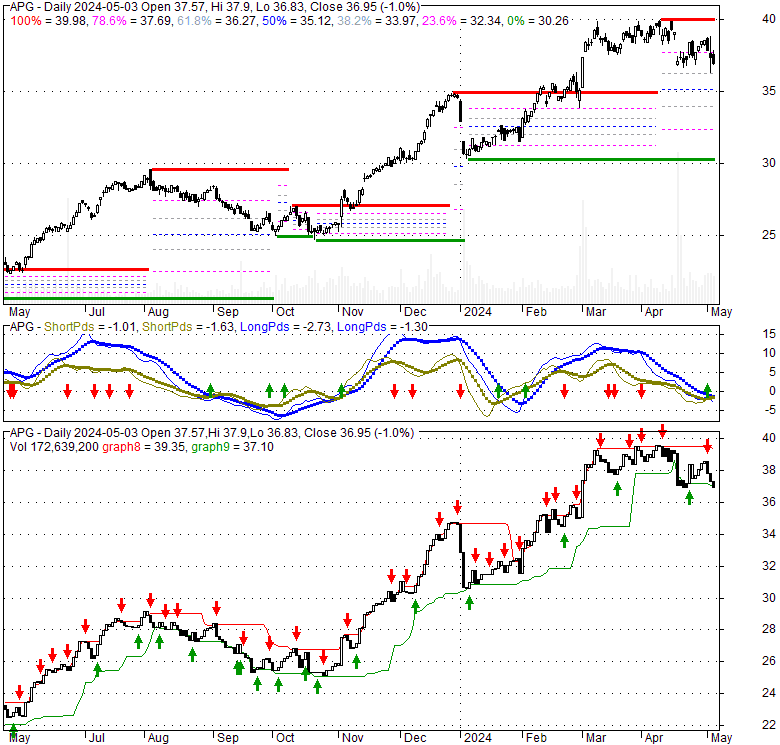
| Price has closed above its short-term moving average. Short-term moving average is currently below mid-term; and above long-term moving average. From the relationship between price and moving averages: This stock is NEUTRAL in short-term; and NEUTRAL in mid-long term.[ APG ] has closed above bottom band by 31.3%. Bollinger Bands are 2.7% wider than normal. The current width of the bands does not suggest anything about the future direction or movement of prices. |
| Company profile |
|---|
| APi Group Corporation provides safety, specialty, and industrial services in North America, Europe, Australia, and the Asian-Pacific. It operates through three segments: Safety Services, Specialty Services, and Industrial Services. The Safety Services segment offers safety solutions focusing on end-to-end integrated occupancy systems, such as fire protection solutions; heating, ventilation, and air conditioning solutions; and entry systems, which include the design, installation, inspection, monitoring, and service of these integrated systems. The Specialty Services segment provides infrastructure and specialized industrial plant services, including maintenance and repair of underground electric, gas, water, sewer, and telecommunications infrastructure. This segment also offers engineering and design, fabrication, installation, and retrofitting and upgrading services. The Industrial Services segment provides various services and solutions comprising pipeline infrastructure, access and road construction, supporting facilities, and integrity management and maintenance to the energy industry focused on transmission and distribution. It serves customers in the public and private sectors, including commercial, industrial, fulfillment centers, distribution, manufacturing, education, healthcare, telecom, transmission, utilities, high tech, entertainment, retail, financial services, and governmental markets. The company was formerly known as J2 Acquisition Limited and changed its name to APi Group Corporation in October 2019. APi Group Corporation was founded in 1926 and is headquartered in New Brighton, Minnesota. |
| Stock chart |
|---|
 |
| Financial Analysis | |
|---|---|
| Price to Book Value: | Outperform |
| P/BV, a ratio used to compare book value to its current market price, to gauge whether a stock is valued properly. | |
| Price to Earnings: | Outperform |
| PE, the ratio for valuing a company that measures its current share price relative to its earnings per share (EPS). | |
| Discounted cash flow: | Outperform |
| DCF, a valuation method used to estimate the value of an investment based on its expected future cash flows. | |
| Return on Assets: | Underperform |
| ROA, indicates how profitable a company is in relation to its total assets, how efficiently uses assets to generate a profit. | |
| Return on Equity: | Underperform |
| ROE, a measure of financial performance calculated by dividing net income by equity. a gauge of profitability and efficiency. | |
| Debt to Equity: | Outperform |
| evaluate financial leverage, reflects the ability of equity to cover outstanding debts in the event of a business downturn. | |
| Stock Basics & Statistics | |
|---|---|
| Exchange: New York Stock Exchange | |
| Sector: Industrials | |
| Industry: Engineering & Construction | |
| Shares Out. (M) | 272.64 |
| Shares Float (M) | 182.45 |
| % Held by Insiders | 12.83 |
| % Held by Institutions | 75.25 |
| Shares Short (K) | 7350 |
| Shares Short Prior Month (K) | 4990 |
| Stock Financials | |
|---|---|
| EPS | -0.680 |
| Book Value (p.s.) | 8.790 |
| Profit Margin | 2.21 |
| Operating Margin | 4.43 |
| Return on Assets (ttm) | 3.0 |
| Return on Equity (ttm) | 5.3 |
| Qtrly Rev. Growth | 3.3 |
| Gross Profit (p.s.) | |
| Sales Per Share | 25.418 |
| EBITDA (p.s.) | 2.472 |
| Qtrly Earnings Growth | |
| Operating Cash Flow (M) | 514.00 |
| Levered Free Cash Flow (M) | 416.25 |
| Stock Valuation | |
|---|---|
| PE Ratio | -55.41 |
| PEG Ratio | 1.10 |
| Price to Book value | 4.29 |
| Price to Sales | 1.48 |
| Price to Cash Flow | 19.99 |
| Stock Dividends | |
|---|---|
| Dividend | |
| Dividend Yield | |
| Dividend Growth | |