| Aspen Technology (AZPN) | |||
|---|---|---|---|
| 188.77 -8.77 (-4.44%) | 05-07 16:00 | ||
| Open: | 197.99 | Pre. Close: | 197.54 |
| High: | 201.1 | Low: | 183.62 |
| Volume: | 837,185 | Market Cap: | 11,996(M) |
| Stock Technical Analysis | |
|---|---|
| Overall: |  |
| Target: | Six months: 242.47 One year: 259.77 |
| Support: | Support1: 183.62 Support2: 152.77 |
| Resistance: | Resistance1: 207.59 Resistance2: 222.41 |
| Pivot: | 197.55 |
| Moving Averages: | MA(5): 196.99 MA(20): 199.96 MA(100): 201.01 MA(250): 189.94 |
| MACD: | MACD(12,26): -2.18 Signal(12,26,9): -1.43 |
| %K %D: | %K(14,3): 34.75 %D(3): 37.55 |
| RSI: | RSI(14): 35.64 |
| 52-Week: | High: 224.77 Low: 161.32 Change(%): 11.6 |
| Average Vol(K): | 3-Month: 222 10-Days: 267 |
| Prices Prediction (Update @5:00pm) | ||
|---|---|---|
| If tomorrow: | Open lower | Open higher |
| High: | 205.069 - 206.246 | 206.246 - 207.308 |
| Low: | 194.721 - 195.981 | 195.981 - 197.117 |
| Close: | 195.736 - 197.746 | 197.746 - 199.561 |
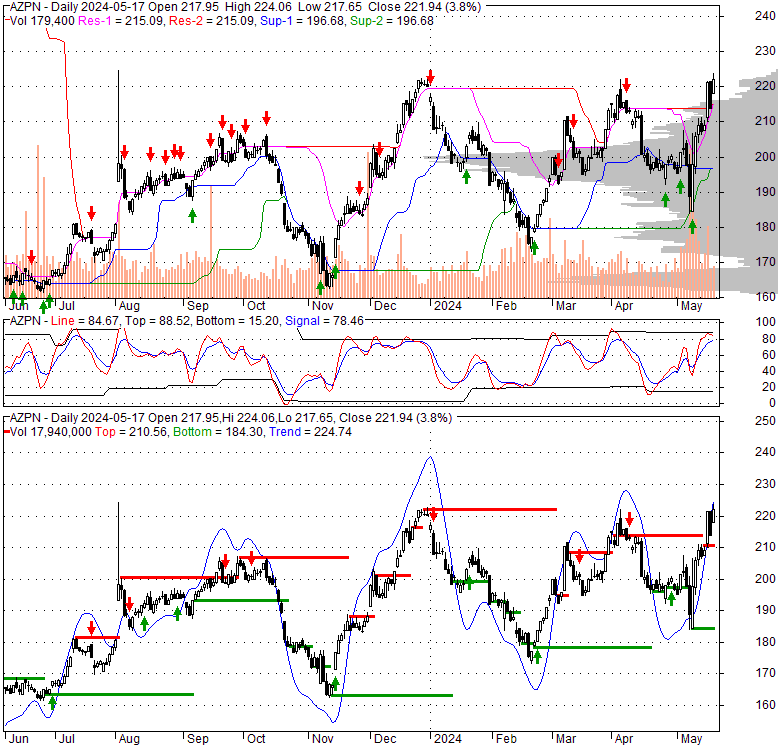
| Price, MAs and Bollinger Bands |
|---|
| Price has closed below its short-term moving average. Short-term moving average is currently below mid-term; and below long-term moving average. From the relationship between price and moving averages: This stock is BEARISH in short-term; and NEUTRAL in mid-long term.[ AZPN ] has closed below the lower bollinger band by 25.0%. If price is in a downtrend band; this downward trend might continue. However a short term pullback inside the band is likely. Bollinger Bands are 52.5% narrower than normal. The narrow width of the bands suggests low volatility as compared to its normal range. The bands have been in this narrow range for 3 bars. This is a sign that the market may be about to initiate a new trend. |
| Company profile |
|---|
| Aspen Technology, Inc. provides enterprise asset performance management, asset performance monitoring, and asset optimization solutions worldwide. The company's solutions address complex environments where it is critical to optimize the asset design, operation, and maintenance lifecycle. It serves bulk chemicals, consumer packaged goods, downstream, food and beverage, metals and mining, midstream and LNG, pharmaceuticals, polymers, pulp and paper, specialty chemicals, transportation, upstream, and water and wastewater industries; power generation, transmission, and distribution industries; and engineering, procurement, and construction industries. The company was incorporated in 2021 and is headquartered in Bedford, Massachusetts. |
| Stock chart |
|---|
 |
| Financial Analysis | |
|---|---|
| Price to Book Value: | Underperform |
| P/BV, a ratio used to compare book value to its current market price, to gauge whether a stock is valued properly. | |
| Price to Earnings: | Underperform |
| PE, the ratio for valuing a company that measures its current share price relative to its earnings per share (EPS). | |
| Discounted cash flow: | Outperform |
| DCF, a valuation method used to estimate the value of an investment based on its expected future cash flows. | |
| Return on Assets: | Underperform |
| ROA, indicates how profitable a company is in relation to its total assets, how efficiently uses assets to generate a profit. | |
| Return on Equity: | Underperform |
| ROE, a measure of financial performance calculated by dividing net income by equity. a gauge of profitability and efficiency. | |
| Debt to Equity: | Underperform |
| evaluate financial leverage, reflects the ability of equity to cover outstanding debts in the event of a business downturn. | |
| Stock Basics & Statistics | |
|---|---|
| Exchange: NASDAQ Global Select | |
| Sector: Technology | |
| Industry: Software - Application | |
| Shares Out. (M) | 63.55 |
| Shares Float (M) | 27.01 |
| % Held by Insiders | 57.73 |
| % Held by Institutions | 47.68 |
| Shares Short (K) | 1480 |
| Shares Short Prior Month (K) | 1370 |
| Stock Financials | |
|---|---|
| EPS | -1.350 |
| Book Value (p.s.) | 201.960 |
| Profit Margin | -8.17 |
| Operating Margin | -19.15 |
| Return on Assets (ttm) | -0.8 |
| Return on Equity (ttm) | -0.7 |
| Qtrly Rev. Growth | 5.9 |
| Gross Profit (p.s.) | |
| Sales Per Share | 16.680 |
| EBITDA (p.s.) | 4.890 |
| Qtrly Earnings Growth | |
| Operating Cash Flow (M) | 291.40 |
| Levered Free Cash Flow (M) | 423.16 |
| Stock Valuation | |
|---|---|
| PE Ratio | -139.83 |
| PEG Ratio | 1.81 |
| Price to Book value | 0.93 |
| Price to Sales | 11.32 |
| Price to Cash Flow | 41.17 |
| Stock Dividends | |
|---|---|
| Dividend | |
| Dividend Yield | |
| Dividend Growth | |


