| Biocept Inc (BIOC) | |||
|---|---|---|---|
| 0.4349 -0.07 (-13.88%) | 10-24 16:00 | ||
| Open: | 0.4901 | Pre. Close: | 0.505 |
| High: | 0.4901 | Low: | 0.4001 |
| Volume: | 671,569 | Market Cap: | 1(M) |
| Stock Technical Analysis | |
|---|---|
| Overall: |  |
| Target: | Six months: 0.27 One year: 0.40 |
| Support: | Support1: 0.04 Support2: 0.04 |
| Resistance: | Resistance1: 0.23 Resistance2: 0.34 |
| Pivot: | 0.05 |
| Moving Averages: | MA(5): 0.05 MA(20): 0.08 MA(100): 0.80 MA(250): 6.29 |
| MACD: | MACD(12,26): -0.10 Signal(12,26,9): -0.12 |
| %K %D: | %K(14,3): 11.78 %D(3): 11.11 |
| RSI: | RSI(14): 29.02 |
| 52-Week: | High: 27 Low: 0.32 Change(%): -99.7 |
| Average Vol(K): | 3-Month: 439 10-Days: 6 |
| Prices Prediction (Update @5:00pm) | ||
|---|---|---|
| If tomorrow: | Open lower | Open higher |
| High: | 0.05 - 0.05 | 0.05 - 0.051 |
| Low: | 0.049 - 0.05 | 0.05 - 0.05 |
| Close: | 0.05 - 0.05 | 0.05 - 0.05 |
| Price, MAs and Bollinger Bands |
|---|
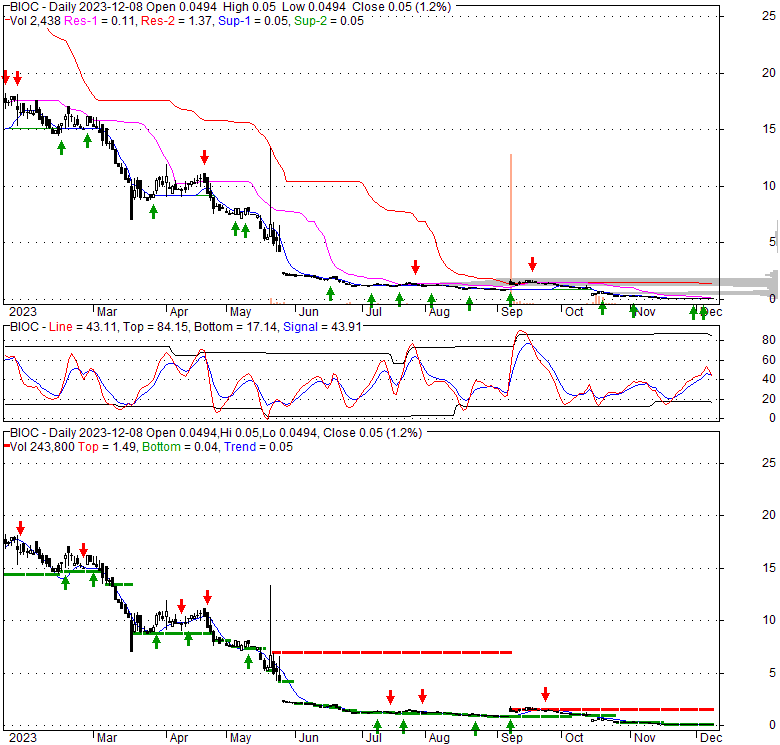
| Price has closed below its short-term moving average. Short-term moving average is currently below mid-term; and below long-term moving average. From the relationship between price and moving averages: This stock is BEARISH in short-term; and BEARISH in mid-long term.[ BIOC ] has closed above bottom band by 31.9%. Bollinger Bands are 95.9% narrower than normal. The narrow width of the bands suggests low volatility as compared to its normal range. The bands have been in this narrow range for 9 bars. This is a sign that the market may be about to initiate a new trend. |
| Company profile |
|---|
| Biocept, Inc., a molecular oncology diagnostics company, develops and commercializes proprietary circulating tumor cell and circulating cell-free tumor DNA and RNA assays utilizing a standard blood sample. Its cancer assays provide information to healthcare providers to identify oncogenic alterations that qualify a subset of cancer patients for targeted therapy at diagnosis, progression, and monitoring to identify resistance mechanisms. The company offers assays for solid tumor indications, such as breast cancer, non-small cell lung cancer (NSCLC), gastric cancer, colorectal cancer, prostate cancer, pancreaticobiliary cancer, and ovarian cancer. It also provides cerebrospinal fluid tumor cell and ctDNA and ctRNA testing services to medical oncologists, neuro-oncologists, surgical oncologists, urologists, pulmonologists, pathologists, and other physicians; clinical trial and research services to pharmaceutical companies, biopharmaceutical companies and clinical research organizations; and RT-PCR testing services for COVID-19. The company has a collaboration with CLEARED4 to develop a system for tracking and managing COVID-19 testing requirements and test results for its customers; and with Protean BioDiagnostics, Inc. to research the ability of its Target Selector molecular assay to determine EGFR status in NSCLC patients. Biocept, Inc. was incorporated in 1997 and is headquartered in San Diego, California. |
| Stock chart |
|---|
 |
| Financial Analysis | |
|---|---|
| Price to Book Value: | Outperform |
| P/BV, a ratio used to compare book value to its current market price, to gauge whether a stock is valued properly. | |
| Price to Earnings: | Neutral |
| PE, the ratio for valuing a company that measures its current share price relative to its earnings per share (EPS). | |
| Discounted cash flow: | Outperform |
| DCF, a valuation method used to estimate the value of an investment based on its expected future cash flows. | |
| Return on Assets: | Underperform |
| ROA, indicates how profitable a company is in relation to its total assets, how efficiently uses assets to generate a profit. | |
| Return on Equity: | Underperform |
| ROE, a measure of financial performance calculated by dividing net income by equity. a gauge of profitability and efficiency. | |
| Debt to Equity: | Outperform |
| evaluate financial leverage, reflects the ability of equity to cover outstanding debts in the event of a business downturn. | |
| Stock Basics & Statistics | |
|---|---|
| Exchange: NASDAQ Capital Market | |
| Sector: Healthcare | |
| Industry: Medical - Diagnostics & Research | |
| Shares Out. (M) | |
| Shares Float (M) | 2.63 |
| % Held by Insiders | 2620000.00 |
| % Held by Institutions | 9.21 |
| Shares Short (K) | 611 |
| Shares Short Prior Month (K) | |
| Stock Financials | |
|---|---|
| EPS | -31330000.000 |
| Book Value (p.s.) | |
| Profit Margin | |
| Operating Margin | |
| Return on Assets (ttm) | 38.0 |
| Return on Equity (ttm) | -51.7 |
| Qtrly Rev. Growth | 1360000.0 |
| Gross Profit (p.s.) | -149.833 |
| Sales Per Share | -311.567 |
| EBITDA (p.s.) | -4300000.000 |
| Qtrly Earnings Growth | -48.17 |
| Operating Cash Flow (M) | |
| Levered Free Cash Flow (M) | -17.60 |
| Stock Valuation | |
|---|---|
| PE Ratio | |
| PEG Ratio | |
| Price to Book value | |
| Price to Sales | |
| Price to Cash Flow | 0.25 |
| Stock Dividends | |
|---|---|
| Dividend | |
| Dividend Yield | |
| Dividend Growth | 15000.000 |