| Builders Firstsource (BLDR) | |||
|---|---|---|---|
| 195.81 7.07 (3.75%) | 05-03 16:00 | ||
| Open: | 196.84 | Pre. Close: | 188.74 |
| High: | 200.715 | Low: | 195.49 |
| Volume: | 1,562,556 | Market Cap: | 23,885(M) |
| Stock Technical Analysis | |
|---|---|
| Overall: |  |
| Target: | Six months: 245.28 One year: 286.49 |
| Support: | Support1: 188.44 Support2: 175.12 |
| Resistance: | Resistance1: 210.00 Resistance2: 245.28 |
| Pivot: | 184.64 |
| Moving Averages: | MA(5): 187.84 MA(20): 186.76 MA(100): 182.99 MA(250): 150.87 |
| MACD: | MACD(12,26): -1.82 Signal(12,26,9): -2.97 |
| %K %D: | %K(14,3): 68.41 %D(3): 56.77 |
| RSI: | RSI(14): 57.02 |
| 52-Week: | High: 214.7 Low: 105.24 Change(%): 76.0 |
| Average Vol(K): | 3-Month: 1250 10-Days: 1128 |
| Prices Prediction (Update @5:00pm) | ||
|---|---|---|
| If tomorrow: | Open lower | Open higher |
| High: | 201.111 - 201.922 | 201.922 - 202.758 |
| Low: | 193.516 - 194.35 | 194.35 - 195.21 |
| Close: | 194.453 - 195.89 | 195.89 - 197.371 |
| Price, MAs and Bollinger Bands |
|---|
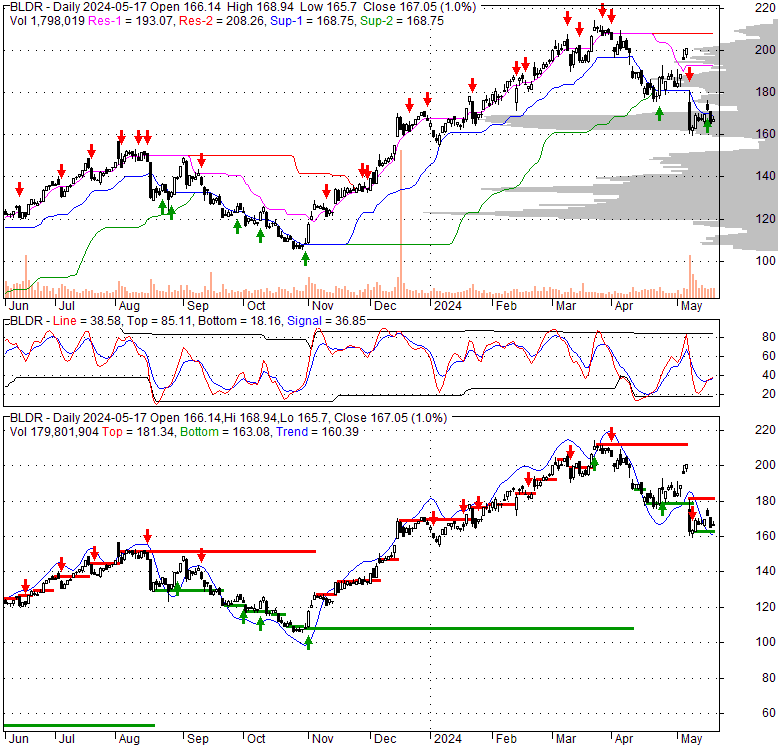
| Price has closed above its short-term moving average. Short-term moving average is currently below mid-term; and above long-term moving average. From the relationship between price and moving averages: This stock is NEUTRAL in short-term; and NEUTRAL in mid-long term.[ BLDR ] has closed Bollinger Bands are 20.6% narrower than normal. The current width of the bands does not suggest anything about the future direction or movement of prices. |
| Company profile |
|---|
| Builders FirstSource, Inc., together with its subsidiaries, manufactures and supplies building materials, manufactured components, and construction services to professional homebuilders, sub-contractors, remodelers, and consumers in the United States. It offers lumber and lumber sheet goods comprising dimensional lumber, plywood, and oriented strand board products that are used in on-site house framing; manufactured products, such as wood floor and roof trusses, steel roof trusses, wall panels, stairs, and engineered wood products; and windows, and interior and exterior door units, as well as interior and exterior trims and custom products under the Synboard brand name. The company also offers gypsum, roofing, and insulation products, including wallboards, ceilings, joint treatments, and finishes; and siding, metal, and concrete products, such as vinyl, composite, and wood siding products, as well as exterior trims, other exteriors, metal studs, and cement products. In addition, it provides other building products and services, such as cabinets and hardware, as well as turn-key framing, shell construction, design assistance, and professional installation services. The company was formerly known as BSL Holdings, Inc. and changed its name to Builders FirstSource, Inc. in October 1999. Builders FirstSource, Inc. was founded in 1998 and is based in Dallas, Texas. |
| Stock chart |
|---|
 |
| Financial Analysis | |
|---|---|
| Price to Book Value: | Outperform |
| P/BV, a ratio used to compare book value to its current market price, to gauge whether a stock is valued properly. | |
| Price to Earnings: | Neutral |
| PE, the ratio for valuing a company that measures its current share price relative to its earnings per share (EPS). | |
| Discounted cash flow: | Outperform |
| DCF, a valuation method used to estimate the value of an investment based on its expected future cash flows. | |
| Return on Assets: | Outperform |
| ROA, indicates how profitable a company is in relation to its total assets, how efficiently uses assets to generate a profit. | |
| Return on Equity: | Outperform |
| ROE, a measure of financial performance calculated by dividing net income by equity. a gauge of profitability and efficiency. | |
| Debt to Equity: | Outperform |
| evaluate financial leverage, reflects the ability of equity to cover outstanding debts in the event of a business downturn. | |
| Stock Basics & Statistics | |
|---|---|
| Exchange: New York Stock Exchange | |
| Sector: Industrials | |
| Industry: Construction | |
| Shares Out. (M) | 121.94 |
| Shares Float (M) | 119.20 |
| % Held by Insiders | 1.97 |
| % Held by Institutions | 97.65 |
| Shares Short (K) | 2720 |
| Shares Short Prior Month (K) | 3300 |
| Stock Financials | |
|---|---|
| EPS | 11.930 |
| Book Value (p.s.) | 38.830 |
| Profit Margin | 9.01 |
| Operating Margin | 11.81 |
| Return on Assets (ttm) | 12.9 |
| Return on Equity (ttm) | 31.8 |
| Qtrly Rev. Growth | -4.7 |
| Gross Profit (p.s.) | |
| Sales Per Share | 140.233 |
| EBITDA (p.s.) | 22.388 |
| Qtrly Earnings Growth | 7.70 |
| Operating Cash Flow (M) | 2310.00 |
| Levered Free Cash Flow (M) | 1580.00 |
| Stock Valuation | |
|---|---|
| PE Ratio | 16.41 |
| PEG Ratio | -1.14 |
| Price to Book value | 5.04 |
| Price to Sales | 1.40 |
| Price to Cash Flow | 10.34 |
| Stock Dividends | |
|---|---|
| Dividend | |
| Dividend Yield | |
| Dividend Growth | |