
| Banco Santander Brasil S.A. ADR (BSBR) | |||
|---|---|---|---|
| 5.96 -0.06 (-1%) | 09-04 16:00 | ||
| Open: | 5.94 | Pre. Close: | 6.02 |
| High: | 5.99 | Low: | 5.94 |
| Volume: | 7,140,399 | Market Cap: | 44,626(M) |
| Stock Technical Analysis | |
|---|---|
| Overall: |  |
| Target: | Six months: 7.04 One year: 8.23 |
| Support: | Support1: 5.73 Support2: 5.54 |
| Resistance: | Resistance1: 6.03 Resistance2: 7.04 |
| Pivot: | 5.76  |
| Moving Averages: | MA(5): 5.87 MA(20): 5.76 MA(100): 5.48  MA(250): 5.68 |
| MACD: | MACD(12,26): 0.11 Signal(12,26,9): 0.10 |
| %K %D: | %K(14,3): 94.65 %D(3): 83.23 |
| RSI: | RSI(14): 64.12 |
| 52-Week: | High: 7.32 Low: 4.94 Change(%): 15.6 |
| Average Vol(K): | 3-Month: 3276 10-Days: 4432 |
| Prices Prediction (Update @5:00pm) | ||
|---|---|---|
| If tomorrow: | Open lower | Open higher |
| High: | 5.996 - 6.031 | 6.031 - 6.062 |
| Low: | 5.86 - 5.898 | 5.898 - 5.932 |
| Close: | 5.915 - 5.976 | 5.976 - 6.031 |
| Price, MAs and Bollinger Bands |
|---|
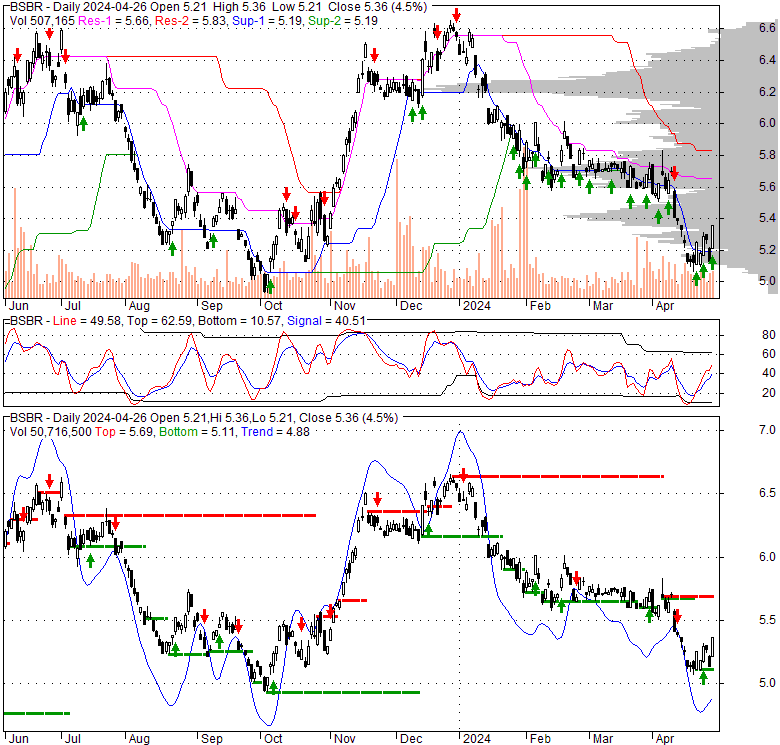
| Price has closed above its short-term moving average. Short-term moving average is currently above mid-term; and above long-term moving average. From the relationship between price and moving averages: This stock is BULLISH in short-term; and BULLISH in mid-long term.[ BSBR ] has closed below upper band by 8.6%. Bollinger Bands are 9.8% narrower than normal. The current width of the bands does not suggest anything about the future direction or movement of prices. |
| Company profile |
|---|
| Banco Santander (Brasil) S.A., together with its affiliated entities, operates as a prominent financial institution delivering an extensive array of banking and financial services. Its diverse client base includes individuals, small and medium-sized enterprises (SMEs), and large corporate customers, both within Brazil and internationally. The company's operations are strategically divided into two primary segments: Commercial Banking and Global Wholesale Banking. Its core offerings encompass deposit accounts and various bank funding instruments, alongside a broad spectrum of payment solutions such as debit and credit cards, digital prepaid services, a robust payment platform, and loyalty programs. Santander Brasil also facilitates employee benefit vouchers, payroll loans, digital lending, and online debt renegotiation services. In the area of secured lending, it provides mortgages and home equity financing products, complementing general consumer credit options. For its business clients, the bank extends local and commercial loans, trade finance, guarantees, and sophisticated structured loans, in addition to comprehensive cash management and funding solutions, including on-lending transfer services. The institution's expertise also covers financial advisory for projects, the origination and distribution of fixed-income securities in debt capital markets, financing for acquisitions, syndicated loans, and other complex structured financing arrangements, including subordinated debt and initiatives focused on energy efficiency. Furthermore, it offers advisory services for mergers and acquisitions (M&A) and equity capital market (ECM) transactions, supported by stock brokerage, equity advisory, and in-depth equity research. Santander Brasil is also active in structuring and providing foreign exchange (FX), derivative, and diverse investment products tailored for institutional, corporate, and retail investors, alongside offering vital market-making services. The bank continues to innovate by delivering instant payment solutions, a specialized suite of products and services for the agribusiness sector, and microfinance services. Its digital footprint extends to online automotive listing platforms, digital car insurance solutions, and a sophisticated digital trading platform. Customers can access these financial products and services through an extensive multi-channel distribution network, which includes traditional branches, mini-branches, ATMs, call centers, and comprehensive internet and mobile banking platforms. Banco Santander (Brasil) S.A. was founded in 1985 and has its principal headquarters situated in São Paulo, Brazil. |
| Stock chart |
|---|
 |
| Financial Analysis | |
|---|---|
| Price to Book Value: | Underperform |
| P/BV, a ratio used to compare book value to its current market price, to gauge whether a stock is valued properly. | |
| Price to Earnings: | Neutral |
| PE, the ratio for valuing a company that measures its current share price relative to its earnings per share (EPS). | |
| Discounted cash flow: | Neutral |
| DCF, a valuation method used to estimate the value of an investment based on its expected future cash flows. | |
| Return on Assets: | Outperform |
| ROA, indicates how profitable a company is in relation to its total assets, how efficiently uses assets to generate a profit. | |
| Return on Equity: | Outperform |
| ROE, a measure of financial performance calculated by dividing net income by equity. a gauge of profitability and efficiency. | |
| Debt to Equity: | Underperform |
| evaluate financial leverage, reflects the ability of equity to cover outstanding debts in the event of a business downturn. | |
| Stock Basics & Statistics | |
|---|---|
| Exchange: New York Stock Exchange | |
| Sector: Financial Services | |
| Industry: Banks - Regional | |
| Shares Out. (M) | 7490.00 |
| Shares Float (M) | 1870.00 |
| % Held by Insiders | 13.69 |
| % Held by Institutions | 0.95 |
| Shares Short (K) | 8340 |
| Shares Short Prior Month (K) | 7380 |
| Stock Financials | |
|---|---|
| EPS | 0.340 |
| Book Value (p.s.) | 13.090 |
| Profit Margin | 28.66 |
| Operating Margin | 33.22 |
| Return on Assets (ttm) | 1.1 |
| Return on Equity (ttm) | 11.1 |
| Qtrly Rev. Growth | 28.8 |
| Gross Profit (p.s.) | 6.338 |
| Sales Per Share | 6.447 |
| EBITDA (p.s.) | |
| Qtrly Earnings Growth | 49.80 |
| Operating Cash Flow (M) | 40730.00 |
| Levered Free Cash Flow (M) | |
| Stock Valuation | |
|---|---|
| PE Ratio | 17.57 |
| PEG Ratio | 0.42 |
| Price to Book value | 0.46 |
| Price to Sales | 0.93 |
| Price to Cash Flow | 1.10 |
| Stock Dividends | |
|---|---|
| Dividend | 0.100 |
| Dividend Yield | 0.02 |
| Dividend Growth | |


