| Compania Mina Buenaventura S.A. ADR (BVN) | |||
|---|---|---|---|
| 17.38 0.48 (2.84%) | 04-26 16:00 | ||
| Open: | 17.06 | Pre. Close: | 16.9 |
| High: | 17.4 | Low: | 16.925 |
| Volume: | 896,771 | Market Cap: | 4,410(M) |
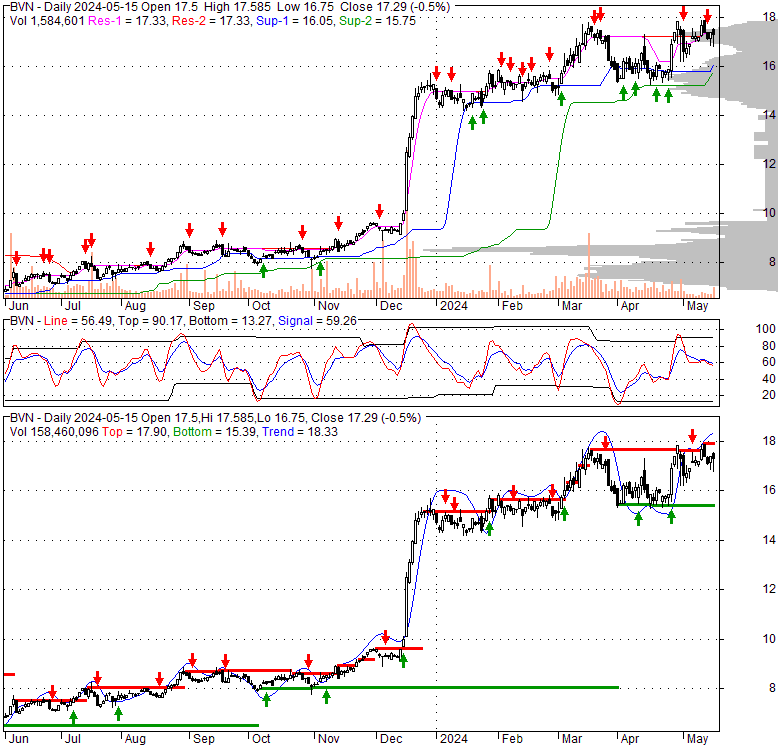
| Stock Technical Analysis | |
|---|---|
| Overall: |  |
| Target: | Six months: 20.32 One year: 23.74 |
| Support: | Support1: 16.06 Support2: 15.23 |
| Resistance: | Resistance1: 17.40 Resistance2: 20.32 |
| Pivot: | 16.08 |
| Moving Averages: | MA(5): 16.33 MA(20): 16.02 MA(100): 15.01 MA(250): 10.76 |
| MACD: | MACD(12,26): 0.10 Signal(12,26,9): -0.02 |
| %K %D: | %K(14,3): 69.38 %D(3): 46.88 |
| RSI: | RSI(14): 65.73 |
| 52-Week: | High: 17.8 Low: 6.45 Change(%): 145.8 |
| Average Vol(K): | 3-Month: 1642 10-Days: 1411 |
| Prices Prediction (Update @5:00pm) | ||
|---|---|---|
| If tomorrow: | Open lower | Open higher |
| High: | 17.426 - 17.496 | 17.496 - 17.569 |
| Low: | 16.749 - 16.821 | 16.821 - 16.896 |
| Close: | 17.26 - 17.387 | 17.387 - 17.519 |
| Price, MAs and Bollinger Bands |
|---|
| Price has closed above its short-term moving average. Short-term moving average is currently above mid-term; and above long-term moving average. From the relationship between price and moving averages: This stock is BULLISH in short-term; and BULLISH in mid-long term.[ BVN ] has closed Bollinger Bands are 21.2% narrower than normal. The current width of the bands does not suggest anything about the future direction or movement of prices. |
| Company profile |
|---|
| Compañía de Minas Buenaventura S.A.A. engages in the exploration, mining development, processing, and trading of precious and base metals. The company explores for gold, silver, lead, zinc, and copper metals. It operates operating mining units, including Tambomayo located in the Caylloma province, Orcopampa Unit located in the province of Castilla, Uchucchacua located in province of Oyón, Julcani located in province of Angaraes, Peru, as well as San Gabrie located in the province of General Sánchez Cerro, in the Moquegua region. The company also owns interests in Colquijirca, La Zanja, Yanacocha, Cerro Verde, El Brocal, Coimolache, Yumpaq, San Gregorio mines, and Trapiche mining unit. In addition, it produces manganese sulphate monohydrate and other by-products generated from minerals; and operates hydroelectric power plants. The company was incorporated in 1953 and is based in Lima, Peru. |
| Stock chart |
|---|
 |
| Stock News |
|---|
|
Wed, 24 Apr 2024 Financial Health Check: Examining Compania de Minas Buenaventura S.A. ADR (BVN)'s Key Ratios – DWinneX - The Dwinnex Mon, 19 Feb 2024 BVN Stock Quote Price and Forecast - CNN Sun, 11 Feb 2018 BUENAVC1 Stock Price and Chart — BVL:BUENAVC1 - TradingView Wed, 03 May 2017 Best Gold Mining Stocks - Lombardi Letter Mon, 29 Apr 2024 Mon, 29 Apr 2024 |
| Financial Analysis | |
|---|---|
| Price to Book Value: | Neutral |
| P/BV, a ratio used to compare book value to its current market price, to gauge whether a stock is valued properly. | |
| Price to Earnings: | Underperform |
| PE, the ratio for valuing a company that measures its current share price relative to its earnings per share (EPS). | |
| Discounted cash flow: | Underperform |
| DCF, a valuation method used to estimate the value of an investment based on its expected future cash flows. | |
| Return on Assets: | Outperform |
| ROA, indicates how profitable a company is in relation to its total assets, how efficiently uses assets to generate a profit. | |
| Return on Equity: | Outperform |
| ROE, a measure of financial performance calculated by dividing net income by equity. a gauge of profitability and efficiency. | |
| Debt to Equity: | Outperform |
| evaluate financial leverage, reflects the ability of equity to cover outstanding debts in the event of a business downturn. | |
| Stock Basics & Statistics | |
|---|---|
| Exchange: New York Stock Exchange | |
| Sector: Basic Materials | |
| Industry: Other Precious Metals | |
| Shares Out. (M) | 253.99 |
| Shares Float (M) | 144.03 |
| % Held by Insiders | 18.94 |
| % Held by Institutions | 51.23 |
| Shares Short (K) | 12570 |
| Shares Short Prior Month (K) | 2850 |
| Stock Financials | |
|---|---|
| EPS | 2.210 |
| Book Value (p.s.) | 11.840 |
| Profit Margin | 2.41 |
| Operating Margin | 0.74 |
| Return on Assets (ttm) | -0.3 |
| Return on Equity (ttm) | 1.3 |
| Qtrly Rev. Growth | 3.0 |
| Gross Profit (p.s.) | |
| Sales Per Share | 3.244 |
| EBITDA (p.s.) | 0.625 |
| Qtrly Earnings Growth | |
| Operating Cash Flow (M) | 227.07 |
| Levered Free Cash Flow (M) | -57.41 |
| Stock Valuation | |
|---|---|
| PE Ratio | 7.86 |
| PEG Ratio | 1.02 |
| Price to Book value | 1.47 |
| Price to Sales | 5.36 |
| Price to Cash Flow | 19.44 |
| Stock Dividends | |
|---|---|
| Dividend | |
| Dividend Yield | |
| Dividend Growth | |


