| Canopy Growth Corp (CGC) | |||
|---|---|---|---|
| 9.5206 0.821 (9.42%) | 04-26 11:20 | ||
| Open: | 8.8 | Pre. Close: | 8.7 |
| High: | 10.24 | Low: | 8.77 |
| Volume: | 9,159,307 | Market Cap: | 867(M) |
| Stock Technical Analysis | |
|---|---|
| Overall: |  |
| Target: | Six months: 13.51 One year: 15.78 |
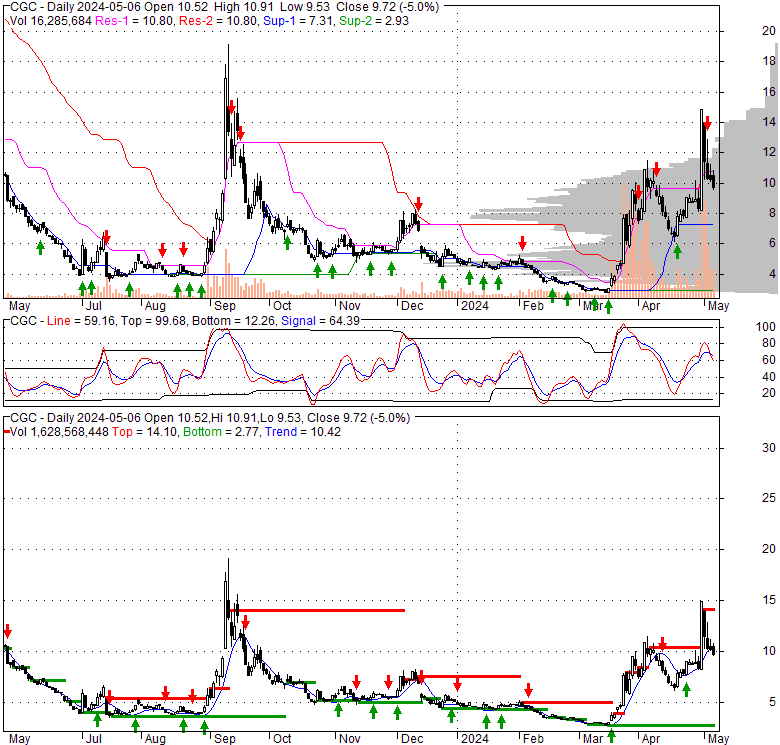
| Support: | Support1: 7.30 Support2: 4.66 |
| Resistance: | Resistance1: 11.57 Resistance2: 13.51 |
| Pivot: | 8.31 |
| Moving Averages: | MA(5): 8.88 MA(20): 8.57 MA(100): 5.47 MA(250): 6.28 |
| MACD: | MACD(12,26): 0.72 Signal(12,26,9): 0.74 |
| %K %D: | %K(14,3): 62.02 %D(3): 53.94 |
| RSI: | RSI(14): 63.00 |
| 52-Week: | High: 19.2 Low: 2.755 Change(%): -24.3 |
| Average Vol(K): | 3-Month: 12196 10-Days: 8753 |
| Prices Prediction (Update @5:00pm) | ||
|---|---|---|
| If tomorrow: | Open lower | Open higher |
| High: | 9.111 - 9.168 | 9.168 - 9.208 |
| Low: | 8.508 - 8.578 | 8.578 - 8.626 |
| Close: | 8.609 - 8.71 | 8.71 - 8.782 |
| Price, MAs and Bollinger Bands |
|---|
| Price has closed above its short-term moving average. Short-term moving average is currently above mid-term; and above long-term moving average. From the relationship between price and moving averages: This stock is BULLISH in short-term; and BULLISH in mid-long term.[ CGC ] has closed below upper band by 13.9%. Bollinger Bands are 38.4% wider than normal. The current width of the bands does not suggest anything about the future direction or movement of prices. |
| Company profile |
|---|
| Canopy Growth Corporation, together with its subsidiaries, engages in the production, distribution, and sale of cannabis and hemp-based products for recreational and medical purposes primarily in Canada, the United States, and Germany. It operates through two segments, Global Cannabis and Other Consumer Products. The company's products include dried cannabis flower, extracts and concentrates, beverages, gummies, and vapes. It offers its products under the Tweed, 7ACRES, 7ACRES Craft Collective, DOJA, Ace Valley, Quatreau, Deep Space, First + Free, Surity Pro, Spectrum Therapeutics, Vert, Tokyo Smoke, Twd, Martha Stewart CBD, DNA Genetics, BioSteel, Storz & Bickel, This Works, HiWay, Simple Stash, Whisl, and Truverra brands. The company was formerly known as Tweed Marijuana Inc. and changed its name to Canopy Growth Corporation in September 2015. Canopy Growth Corporation was incorporated in 2009 and is headquartered in Smiths Falls, Canada. |
| Stock chart |
|---|
 |
| Stock News |
|---|
|
Wed, 24 Apr 2024 Canopy Growth (NASDAQ:CGC) Shares Gap Down to $9.03 - MarketBeat Sat, 20 Apr 2024 CGC (Canopy Growth) Book Value per Share - GuruFocus.com Mon, 15 Apr 2024 CGC Stock Alert: Canopy Growth Gets Green Light for Canopy USA - InvestorPlace Mon, 15 Apr 2024 Canopy stockholders OK share structure for US marijuana holding company - Marijuana Business Daily Mon, 15 Apr 2024 CANOPY GROWTH ANNOUNCES RESULTS OF SPECIAL MEETING OF SHAREHOLDERS - PR Newswire Thu, 11 Apr 2024 How Canopy Growth Makes Money - Investopedia |
| Financial Analysis | |
|---|---|
| Price to Book Value: | Underperform |
| P/BV, a ratio used to compare book value to its current market price, to gauge whether a stock is valued properly. | |
| Price to Earnings: | Neutral |
| PE, the ratio for valuing a company that measures its current share price relative to its earnings per share (EPS). | |
| Discounted cash flow: | Outperform |
| DCF, a valuation method used to estimate the value of an investment based on its expected future cash flows. | |
| Return on Assets: | Underperform |
| ROA, indicates how profitable a company is in relation to its total assets, how efficiently uses assets to generate a profit. | |
| Return on Equity: | Underperform |
| ROE, a measure of financial performance calculated by dividing net income by equity. a gauge of profitability and efficiency. | |
| Debt to Equity: | Outperform |
| evaluate financial leverage, reflects the ability of equity to cover outstanding debts in the event of a business downturn. | |
| Stock Basics & Statistics | |
|---|---|
| Exchange: NASDAQ Global Select | |
| Sector: Healthcare | |
| Industry: Drug Manufacturers - Specialty & Generic | |
| Shares Out. (M) | 91.11 |
| Shares Float (M) | 73.87 |
| % Held by Insiders | 19.04 |
| % Held by Institutions | 4.86 |
| Shares Short (K) | 11500 |
| Shares Short Prior Month (K) | 4600 |
| Stock Financials | |
|---|---|
| EPS | -15.470 |
| Book Value (p.s.) | 6.570 |
| Profit Margin | |
| Operating Margin | -31.75 |
| Return on Assets (ttm) | -8.9 |
| Return on Equity (ttm) | -121.6 |
| Qtrly Rev. Growth | -7.5 |
| Gross Profit (p.s.) | |
| Sales Per Share | 3.976 |
| EBITDA (p.s.) | -2.697 |
| Qtrly Earnings Growth | |
| Operating Cash Flow (M) | -399.63 |
| Levered Free Cash Flow (M) | -95.08 |
| Stock Valuation | |
|---|---|
| PE Ratio | -0.64 |
| PEG Ratio | -0.20 |
| Price to Book value | 1.50 |
| Price to Sales | 2.47 |
| Price to Cash Flow | -2.24 |
| Stock Dividends | |
|---|---|
| Dividend | |
| Dividend Yield | |
| Dividend Growth | |


