| Chegg Inc (CHGG) | |||
|---|---|---|---|
| 6.88 0.07 (1.03%) | 04-25 16:00 | ||
| Open: | 6.75 | Pre. Close: | 6.81 |
| High: | 6.9 | Low: | 6.7 |
| Volume: | 1,511,096 | Market Cap: | 708(M) |
| Stock Technical Analysis | |
|---|---|
| Overall: |  |
| Target: | Six months: 8.84 One year: 9.52 |
| Support: | Support1: 6.63 Support2: 5.52 |
| Resistance: | Resistance1: 7.57 Resistance2: 8.15 |
| Pivot: | 7.07 |
| Moving Averages: | MA(5): 6.89 MA(20): 7.11 MA(100): 9.11 MA(250): 9.37 |
| MACD: | MACD(12,26): -0.29 Signal(12,26,9): -0.31 |
| %K %D: | %K(14,3): 20.00 %D(3): 21.39 |
| RSI: | RSI(14): 37.50 |
| 52-Week: | High: 18.71 Low: 6.63 Change(%): -62.1 |
| Average Vol(K): | 3-Month: 2641 10-Days: 1943 |
| Prices Prediction (Update @5:00pm) | ||
|---|---|---|
| If tomorrow: | Open lower | Open higher |
| High: | 6.906 - 6.94 | 6.94 - 6.969 |
| Low: | 6.62 - 6.659 | 6.659 - 6.692 |
| Close: | 6.822 - 6.882 | 6.882 - 6.934 |
| Price, MAs and Bollinger Bands |
|---|
| Price has closed below its short-term moving average. Short-term moving average is currently below mid-term; and below long-term moving average. From the relationship between price and moving averages: This stock is BEARISH in short-term; and BEARISH in mid-long term.[ CHGG ] has closed above bottom band by 31.4%. Bollinger Bands are 22.3% narrower than normal. The current width of the bands does not suggest anything about the future direction or movement of prices. |
| Company profile |
|---|
| Chegg, Inc. operates direct-to-student learning platform that supports students starting with their academic journey and extending into their careers with products and services to support and help them better understand their academic course materials. The company offers Chegg Services, which include subscription services; and required materials that comprise its print textbooks and eTextbooks. Its subscription services include Chegg Study, which helps students master challenging concepts on their own; Chegg Writing that provides students with a suite of tools, such as plagiarism detection scans, grammar and writing fluency checking, expert personalized writing feedback, and premium citation generation; Chegg Math, a step-by-step math problem solver and calculator that helps students to solve problems; Chegg Study Pack, a bundle of various Chegg Services product offerings, including Chegg Study, Chegg Writing, and Chegg Math Solver services, which creates an integrated platform of connected academic support services; Busuu, an online language learning solution that offers a comprehensive solution through a combination of self-paced lessons, live classes with expert tutors, and the ability to learn and practice with members of the Busuu language learning community; and Thinkful, a skills-based learning platform that offers professional courses along with networking, interviewing, and career services. The company also provides other services, such as Chegg Life, Chegg Prep, and Chegg Internships; provides personal and professional development skills training; and rents and sells print textbooks and eTextbooks. Chegg, Inc. was incorporated in 2005 and is headquartered in Santa Clara, California. |
| Stock chart |
|---|
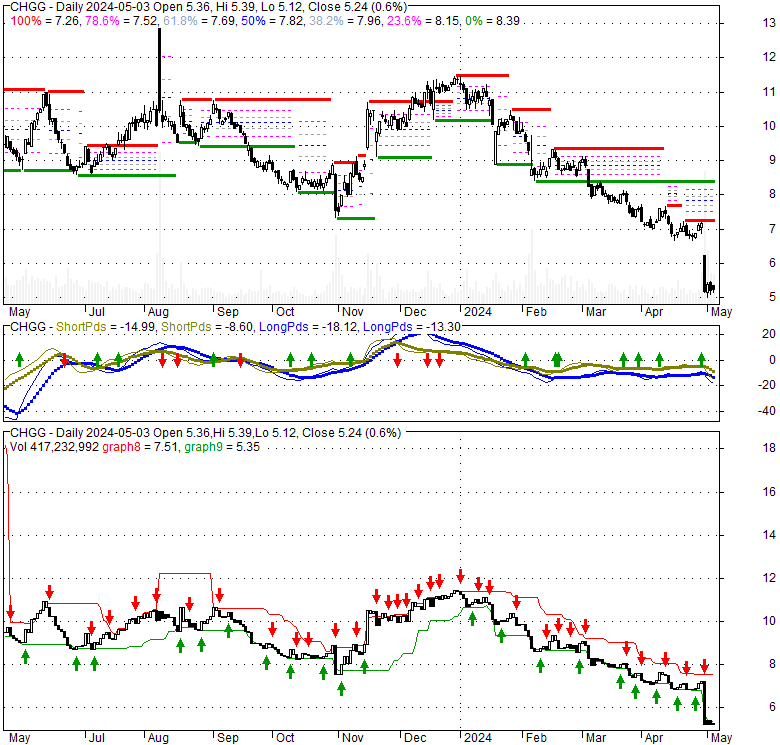 |
| Financial Analysis | |
|---|---|
| Price to Book Value: | Neutral |
| P/BV, a ratio used to compare book value to its current market price, to gauge whether a stock is valued properly. | |
| Price to Earnings: | Outperform |
| PE, the ratio for valuing a company that measures its current share price relative to its earnings per share (EPS). | |
| Discounted cash flow: | Outperform |
| DCF, a valuation method used to estimate the value of an investment based on its expected future cash flows. | |
| Return on Assets: | Neutral |
| ROA, indicates how profitable a company is in relation to its total assets, how efficiently uses assets to generate a profit. | |
| Return on Equity: | Underperform |
| ROE, a measure of financial performance calculated by dividing net income by equity. a gauge of profitability and efficiency. | |
| Debt to Equity: | Outperform |
| evaluate financial leverage, reflects the ability of equity to cover outstanding debts in the event of a business downturn. | |
| Stock Basics & Statistics | |
|---|---|
| Exchange: New York Stock Exchange | |
| Sector: Consumer Defensive | |
| Industry: Education & Training Services | |
| Shares Out. (M) | 102.95 |
| Shares Float (M) | 84.30 |
| % Held by Insiders | 2.98 |
| % Held by Institutions | 100.00 |
| Shares Short (K) | 13610 |
| Shares Short Prior Month (K) | 14890 |
| Stock Financials | |
|---|---|
| EPS | 0.160 |
| Book Value (p.s.) | 9.190 |
| Profit Margin | 2.54 |
| Operating Margin | 27.41 |
| Return on Assets (ttm) | -0.4 |
| Return on Equity (ttm) | 1.8 |
| Qtrly Rev. Growth | -8.4 |
| Gross Profit (p.s.) | |
| Sales Per Share | 6.958 |
| EBITDA (p.s.) | 0.800 |
| Qtrly Earnings Growth | |
| Operating Cash Flow (M) | 246.20 |
| Levered Free Cash Flow (M) | 163.67 |
| Stock Valuation | |
|---|---|
| PE Ratio | 43.00 |
| PEG Ratio | 0.31 |
| Price to Book value | 0.75 |
| Price to Sales | 0.99 |
| Price to Cash Flow | 2.88 |
| Stock Dividends | |
|---|---|
| Dividend | |
| Dividend Yield | |
| Dividend Growth | |


