| CNH Industrial N.V. (CNHI) | |||
|---|---|---|---|
| 11.65 -0.25 (-2.1%) | 05-08 16:00 | ||
| Open: | 11.88 | Pre. Close: | 11.9 |
| High: | 11.935 | Low: | 11.62 |
| Volume: | 8,790,799 | Market Cap: | 14,650(M) |
| Stock Technical Analysis | |
|---|---|
| Overall: |  |
| Target: | Six months: 14.54 One year: 15.53 |
| Support: | Support1: 11.07 Support2: 9.21 |
| Resistance: | Resistance1: 12.45 Resistance2: 13.30 |
| Pivot: | 11.65 |
| Moving Averages: | MA(5): 11.66 MA(20): 11.90 MA(100): 12.10 MA(250): 12.56 |
| MACD: | MACD(12,26): -0.23 Signal(12,26,9): -0.24 |
| %K %D: | %K(14,3): 40.05 %D(3): 34.30 |
| RSI: | RSI(14): 44.18 |
| 52-Week: | High: 15.74 Low: 9.77 Change(%): -18.1 |
| Average Vol(K): | 3-Month: 10884 10-Days: 11635 |
| Prices Prediction (Update @5:00pm) | ||
|---|---|---|
| If tomorrow: | Open lower | Open higher |
| High: | 11.954 - 12.017 | 12.017 - 12.071 |
| Low: | 11.471 - 11.542 | 11.542 - 11.603 |
| Close: | 11.534 - 11.654 | 11.654 - 11.756 |
| Price, MAs and Bollinger Bands |
|---|
| Price has closed below its short-term moving average. Short-term moving average is currently below mid-term; and below long-term moving average. From the relationship between price and moving averages: This stock is BEARISH in short-term; and NEUTRAL in mid-long term.[ CNHI ] has closed below upper band by 49.9%. Bollinger Bands are 12.4% wider than normal. The current width of the bands does not suggest anything about the future direction or movement of prices. |
| Company profile |
|---|
| CNH Industrial N.V. designs, produces, markets, sells, and finances agricultural and construction equipment, trucks, commercial vehicles, buses, and specialty vehicles in North America, Europe, South America, and internationally. It operates through five segments: Agriculture, Construction, Commercial and Specialty Vehicles, Powertrain, and Financial. The Agriculture segment provides farm machinery and implements that include two-and four-wheel drive tractors, crawler tractors, combines, cotton pickers, grape and sugar cane harvesters, hay and forage equipment, planting and seeding equipment, soil preparation and cultivation implements, and material handling equipment under the New Holland Agriculture, Case IH, STEYR, Miller, Kongskilde, Överum, K-Line, and JF brands. The Construction segment offers excavators, crawler dozers, graders, wheel and backhoe loaders, and skid steer and compact track loaders under the CASE Construction and New Holland Construction brands. The Commercial and Specialty Vehicles segment provides light, medium, and heavy vehicles for the transportation and distribution of goods under the IVECO brand; commuter buses and city-buses under the IVECO BUS and Heuliez Bus brands; quarry and mining equipment under the IVECO ASTRA brand; firefighting vehicles under the Magirus brand; and vehicles for civil defense and peace-keeping missions under the Iveco Defence Vehicles brand. The Powertrain segment offers engines, transmission systems, and axles for on- and off-road applications, as well as for marine and power generation under the FPT Industrial brand. The Financial Services segment provides and administers retail financing to customers for the purchase or lease of new and used industrial equipment or vehicles, and other equipment; wholesale financing, which primarily consists of floor plan financing; and trade receivables factoring services. The company was founded in 1842 and is headquartered in London, the United Kingdom. |
| Stock chart |
|---|
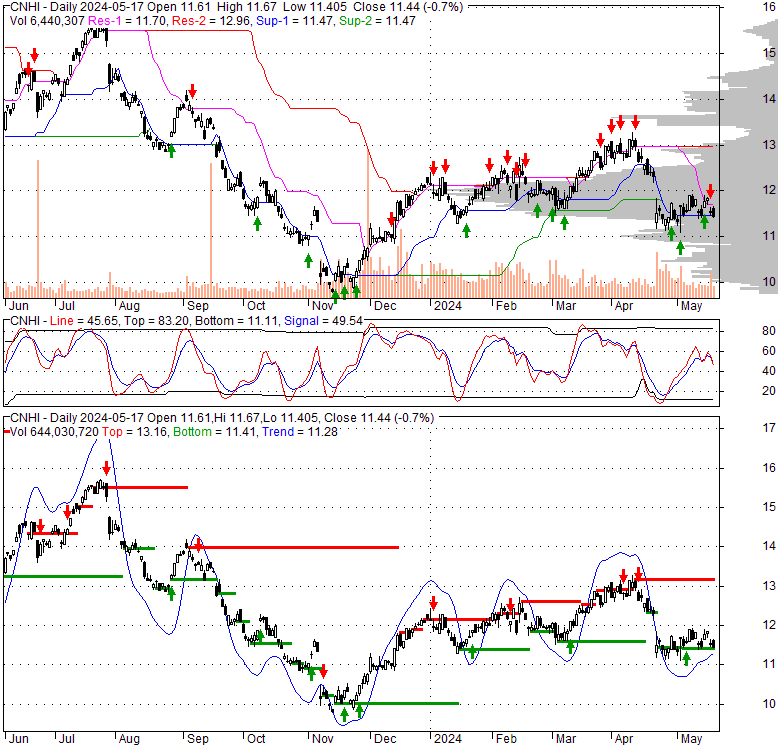 |
| Financial Analysis | |
|---|---|
| Price to Book Value: | Neutral |
| P/BV, a ratio used to compare book value to its current market price, to gauge whether a stock is valued properly. | |
| Price to Earnings: | Underperform |
| PE, the ratio for valuing a company that measures its current share price relative to its earnings per share (EPS). | |
| Discounted cash flow: | Underperform |
| DCF, a valuation method used to estimate the value of an investment based on its expected future cash flows. | |
| Return on Assets: | Neutral |
| ROA, indicates how profitable a company is in relation to its total assets, how efficiently uses assets to generate a profit. | |
| Return on Equity: | Outperform |
| ROE, a measure of financial performance calculated by dividing net income by equity. a gauge of profitability and efficiency. | |
| Debt to Equity: | Outperform |
| evaluate financial leverage, reflects the ability of equity to cover outstanding debts in the event of a business downturn. | |
| Stock Basics & Statistics | |
|---|---|
| Exchange: New York Stock Exchange | |
| Sector: Industrials | |
| Industry: Agricultural - Machinery | |
| Shares Out. (M) | 1250.00 |
| Shares Float (M) | 864.25 |
| % Held by Insiders | 30.05 |
| % Held by Institutions | 69.28 |
| Shares Short (K) | 30640 |
| Shares Short Prior Month (K) | 25930 |
| Stock Financials | |
|---|---|
| EPS | 1.720 |
| Book Value (p.s.) | 6.310 |
| Profit Margin | 9.48 |
| Operating Margin | 9.69 |
| Return on Assets (ttm) | 4.0 |
| Return on Equity (ttm) | 29.7 |
| Qtrly Rev. Growth | -9.8 |
| Gross Profit (p.s.) | |
| Sales Per Share | 19.328 |
| EBITDA (p.s.) | 2.528 |
| Qtrly Earnings Growth | -11.40 |
| Operating Cash Flow (M) | 714.00 |
| Levered Free Cash Flow (M) | |
| Stock Valuation | |
|---|---|
| PE Ratio | 6.77 |
| PEG Ratio | 1.03 |
| Price to Book value | 1.85 |
| Price to Sales | 0.60 |
| Price to Cash Flow | 20.40 |
| Stock Dividends | |
|---|---|
| Dividend | |
| Dividend Yield | |
| Dividend Growth | |


