| Centerpoint Energy Inc (CNP) | |||
|---|---|---|---|
| 28.85 -0.49 (-1.67%) | 04-26 16:00 | ||
| Open: | 29.33 | Pre. Close: | 29.34 |
| High: | 29.35 | Low: | 28.8425 |
| Volume: | 3,238,015 | Market Cap: | 18,263(M) |
| Stock Technical Analysis | |
|---|---|
| Overall: |  |
| Target: | Six months: 34.37 One year: 40.14 |
| Support: | Support1: 27.86 Support2: 26.90 |
| Resistance: | Resistance1: 29.42 Resistance2: 34.37 |
| Pivot: | 28.17 |
| Moving Averages: | MA(5): 28.95 MA(20): 28.18 MA(100): 28.20 MA(250): 28.39 |
| MACD: | MACD(12,26): 0.26 Signal(12,26,9): 0.11 |
| %K %D: | %K(14,3): 89.75 %D(3): 91.69 |
| RSI: | RSI(14): 58.81 |
| 52-Week: | High: 31.44 Low: 25.42 Change(%): -5.3 |
| Average Vol(K): | 3-Month: 4170 10-Days: 4125 |
| Prices Prediction (Update @5:00pm) | ||
|---|---|---|
| If tomorrow: | Open lower | Open higher |
| High: | 29.364 - 29.519 | 29.519 - 29.651 |
| Low: | 28.471 - 28.647 | 28.647 - 28.798 |
| Close: | 28.562 - 28.86 | 28.86 - 29.113 |
| Price, MAs and Bollinger Bands |
|---|
| Price has closed below its short-term moving average. Short-term moving average is currently above mid-term; and above long-term moving average. From the relationship between price and moving averages: This stock is NEUTRAL in short-term; and NEUTRAL in mid-long term.[ CNP ] has closed below upper band by 24.4%. Bollinger Bands are 63.7% wider than normal. The large width of the bands suggest high volatility as compared to its normal range. The bands have been in this wide range for 1 days. This is a sign that the current trend might continue. |
| Company profile |
|---|
| CenterPoint Energy, Inc. operates as a public utility holding company in the United States. The company operates through Electric and Natural Gas segments. The Electric segment includes electric transmission and distribution services to electric customers and electric generation assets, as well as assets in the wholesale power market. The Natural Gas segment provides natural gas distribution services, as well as home appliance maintenance and repair services to customers in Minnesota; and home repair protection plans to natural gas customers in Arkansas, Indiana, Mississippi, Ohio, Oklahoma, and Texas and Louisiana through a third party. This segment also engages in the sale of regulated intrastate natural gas, and transportation and storage of natural gas for residential, commercial, industrial, and transportation customers. As of December 31, 2021, it served approximately 2.7 million metered customers; owned 239 substation sites with a total installed rated transformer capacity of 71,241 megavolt amperes; operated approximately 1,00,000 linear miles of natural gas distribution and transmission mains; and owned and operated 285 miles of intrastate pipeline in Louisiana, Texas, and Oklahoma. The company was founded in 1866 and is headquartered in Houston, Texas. |
| Stock chart |
|---|
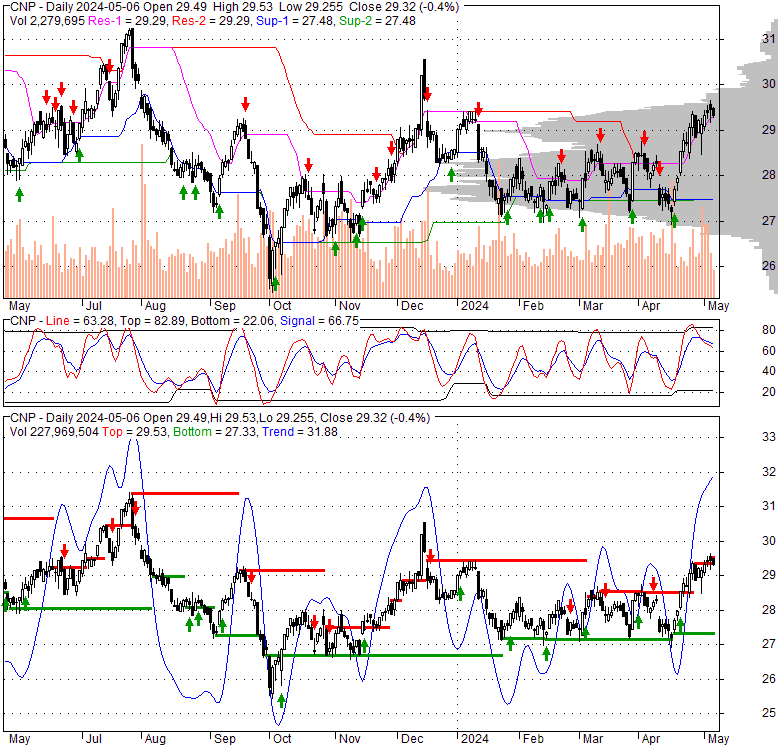 |
| Financial Analysis | |
|---|---|
| Price to Book Value: | Outperform |
| P/BV, a ratio used to compare book value to its current market price, to gauge whether a stock is valued properly. | |
| Price to Earnings: | Outperform |
| PE, the ratio for valuing a company that measures its current share price relative to its earnings per share (EPS). | |
| Discounted cash flow: | Outperform |
| DCF, a valuation method used to estimate the value of an investment based on its expected future cash flows. | |
| Return on Assets: | Underperform |
| ROA, indicates how profitable a company is in relation to its total assets, how efficiently uses assets to generate a profit. | |
| Return on Equity: | Underperform |
| ROE, a measure of financial performance calculated by dividing net income by equity. a gauge of profitability and efficiency. | |
| Debt to Equity: | Outperform |
| evaluate financial leverage, reflects the ability of equity to cover outstanding debts in the event of a business downturn. | |
| Stock Basics & Statistics | |
|---|---|
| Exchange: New York Stock Exchange | |
| Sector: Utilities | |
| Industry: Regulated Electric | |
| Shares Out. (M) | 633.10 |
| Shares Float (M) | 628.59 |
| % Held by Insiders | 0.34 |
| % Held by Institutions | 93.18 |
| Shares Short (K) | 11720 |
| Shares Short Prior Month (K) | 11990 |
| Stock Financials | |
|---|---|
| EPS | 1.370 |
| Book Value (p.s.) | 15.310 |
| Profit Margin | 10.55 |
| Operating Margin | 14.35 |
| Return on Assets (ttm) | 2.8 |
| Return on Equity (ttm) | 9.3 |
| Qtrly Rev. Growth | -19.5 |
| Gross Profit (p.s.) | |
| Sales Per Share | 13.742 |
| EBITDA (p.s.) | 4.691 |
| Qtrly Earnings Growth | 58.60 |
| Operating Cash Flow (M) | 3880.00 |
| Levered Free Cash Flow (M) | -858.37 |
| Stock Valuation | |
|---|---|
| PE Ratio | 21.06 |
| PEG Ratio | 2.24 |
| Price to Book value | 1.88 |
| Price to Sales | 2.10 |
| Price to Cash Flow | 4.71 |
| Stock Dividends | |
|---|---|
| Dividend | |
| Dividend Yield | |
| Dividend Growth | |


