| Coupa Software Inc (COUP) | |||
|---|---|---|---|
| 80.97 0 (0%) | 02-27 16:00 | ||
| Open: | 80.97 | Pre. Close: | 80.97 |
| High: | 80.98 | Low: | 80.95 |
| Volume: | 5,078,184 | Market Cap: | 6,117(M) |
| Stock Technical Analysis | |
|---|---|
| Overall: |  |
| Target: | Six months: 94.58 One year: 110.47 |
| Support: | Support1: 80.16 Support2: 79.65 |
| Resistance: | Resistance1: 80.98 Resistance2: 94.58 |
| Pivot: | 80.63 |
| Moving Averages: | MA(5): 80.97 MA(20): 80.50 MA(100): 69.27 MA(250): 71.16 |
| MACD: | MACD(12,26): 0.55 Signal(12,26,9): 0.63 |
| %K %D: | %K(14,3): 99.05 %D(3): 99.05 |
| RSI: | RSI(14): 77.41 |
| 52-Week: | High: 111.61 Low: 40.295 Change(%): 11.6 |
| Average Vol(K): | 3-Month: 3707 10-Days: 655 |
| Prices Prediction (Update @5:00pm) | ||
|---|---|---|
| If tomorrow: | Open lower | Open higher |
| High: | 81.045 - 81.438 | 81.438 - 81.777 |
| Low: | 80.009 - 80.472 | 80.472 - 80.873 |
| Close: | 80.284 - 80.994 | 80.994 - 81.607 |
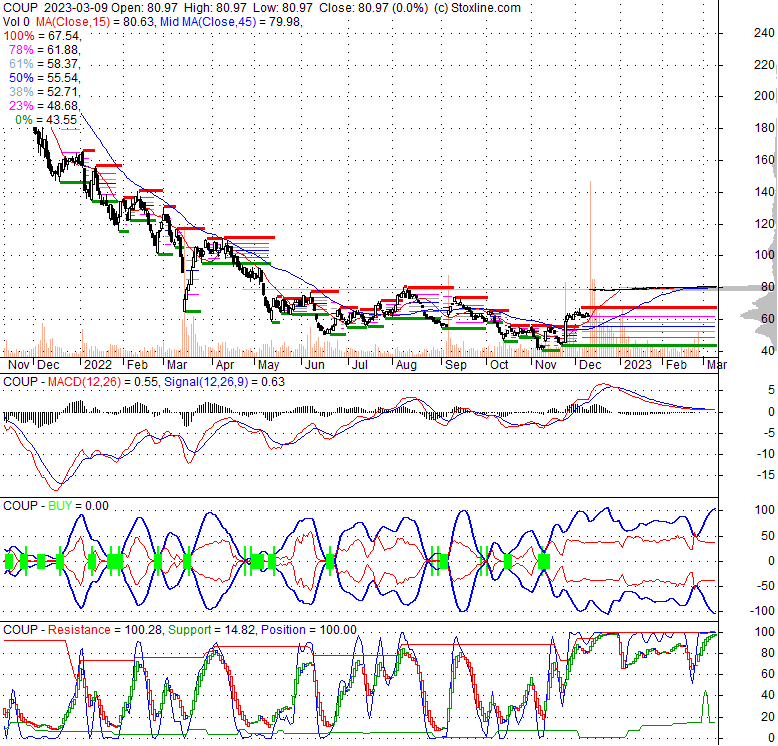
| Price, MAs and Bollinger Bands |
|---|
| Price has closed below its short-term moving average. Short-term moving average is currently above mid-term; and above long-term moving average. From the relationship between price and moving averages: This stock is NEUTRAL in short-term; and BULLISH in mid-long term.[ COUP ] has closed below upper band by 30.3%. Bollinger Bands are 85.6% narrower than normal. The narrow width of the bands suggests low volatility as compared to its normal range. The bands have been in this narrow range for 45 bars. This is a sign that the market may be about to initiate a new trend. |
| Company profile |
|---|
| Coupa Software Incorporated provides cloud-based business spend management platform that connects its customers with suppliers worldwide. The company provides visibility into and control over how companies spend money, optimize supply chains, and manage liquidity, as well as enables businesses to achieve savings that drive profitability. Its platform offers procurement, invoicing, expense management, and payment solutions that form the transactional engine for managing a company's business spend; and specialized solutions, including strategic sourcing, contract management, contingent workforce, supplier risk management, supply chain design and planning, treasury management, and spend analysis. It serves businesses in various industries, including healthcare and pharmaceuticals, retail, financial services, manufacturing, and technology. The company markets its platform primarily through a direct sales force. Coupa Software Incorporated was incorporated in 2006 and is headquartered in San Mateo, California. |
| Stock chart |
|---|
 |
| Financial Analysis | |
|---|---|
| Price to Book Value: | Outperform |
| P/BV, a ratio used to compare book value to its current market price, to gauge whether a stock is valued properly. | |
| Price to Earnings: | Underperform |
| PE, the ratio for valuing a company that measures its current share price relative to its earnings per share (EPS). | |
| Discounted cash flow: | Outperform |
| DCF, a valuation method used to estimate the value of an investment based on its expected future cash flows. | |
| Return on Assets: | Neutral |
| ROA, indicates how profitable a company is in relation to its total assets, how efficiently uses assets to generate a profit. | |
| Return on Equity: | Underperform |
| ROE, a measure of financial performance calculated by dividing net income by equity. a gauge of profitability and efficiency. | |
| Debt to Equity: | Outperform |
| evaluate financial leverage, reflects the ability of equity to cover outstanding debts in the event of a business downturn. | |
| Stock Basics & Statistics | |
|---|---|
| Exchange: NASDAQ Global Select | |
| Sector: Technology | |
| Industry: Software - Application | |
| Shares Out. (M) | 75.54 |
| Shares Float (M) | 75.60 |
| % Held by Insiders | 0.71 |
| % Held by Institutions | 95.39 |
| Shares Short (K) | 6880 |
| Shares Short Prior Month (K) | 5710 |
| Stock Financials | |
|---|---|
| EPS | -4.500 |
| Book Value (p.s.) | 3.730 |
| Profit Margin | -41.24 |
| Operating Margin | -33.83 |
| Return on Assets (ttm) | -5.5 |
| Return on Equity (ttm) | -53.0 |
| Qtrly Rev. Growth | 17.0 |
| Gross Profit (p.s.) | 5.455 |
| Sales Per Share | 10.830 |
| EBITDA (p.s.) | -1.911 |
| Qtrly Earnings Growth | |
| Operating Cash Flow (M) | 214.32 |
| Levered Free Cash Flow (M) | 345.21 |
| Stock Valuation | |
|---|---|
| PE Ratio | -17.99 |
| PEG Ratio | 33.63 |
| Price to Book value | 21.71 |
| Price to Sales | 7.48 |
| Price to Cash Flow | 28.54 |
| Stock Dividends | |
|---|---|
| Dividend | |
| Dividend Yield | |
| Dividend Growth | |


