| Cardiff Oncology Inc (CRDF) | |||
|---|---|---|---|
| 4.07 0.08 (2.01%) | 04-26 16:00 | ||
| Open: | 3.99 | Pre. Close: | 3.99 |
| High: | 4.129 | Low: | 3.98 |
| Volume: | 516,037 | Market Cap: | 182(M) |
| Stock Technical Analysis | |
|---|---|
| Overall: |  |
| Target: | Six months: 6.40 One year: 7.50 |
| Support: | Support1: 3.95 Support2: 3.29 |
| Resistance: | Resistance1: 5.48 Resistance2: 6.42 |
| Pivot: | 4.84 |
| Moving Averages: | MA(5): 4.15 MA(20): 5.03 MA(100): 2.89 MA(250): 2.07 |
| MACD: | MACD(12,26): -0.15 Signal(12,26,9): 0.07 |
| %K %D: | %K(14,3): 4.00 %D(3): 4.54 |
| RSI: | RSI(14): 38.61 |
| 52-Week: | High: 6.42 Low: 0.94 Change(%): 133.9 |
| Average Vol(K): | 3-Month: 1935 10-Days: 765 |
| Prices Prediction (Update @5:00pm) | ||
|---|---|---|
| If tomorrow: | Open lower | Open higher |
| High: | 4.134 - 4.154 | 4.154 - 4.171 |
| Low: | 3.933 - 3.956 | 3.956 - 3.975 |
| Close: | 4.036 - 4.071 | 4.071 - 4.102 |
| Price, MAs and Bollinger Bands |
|---|
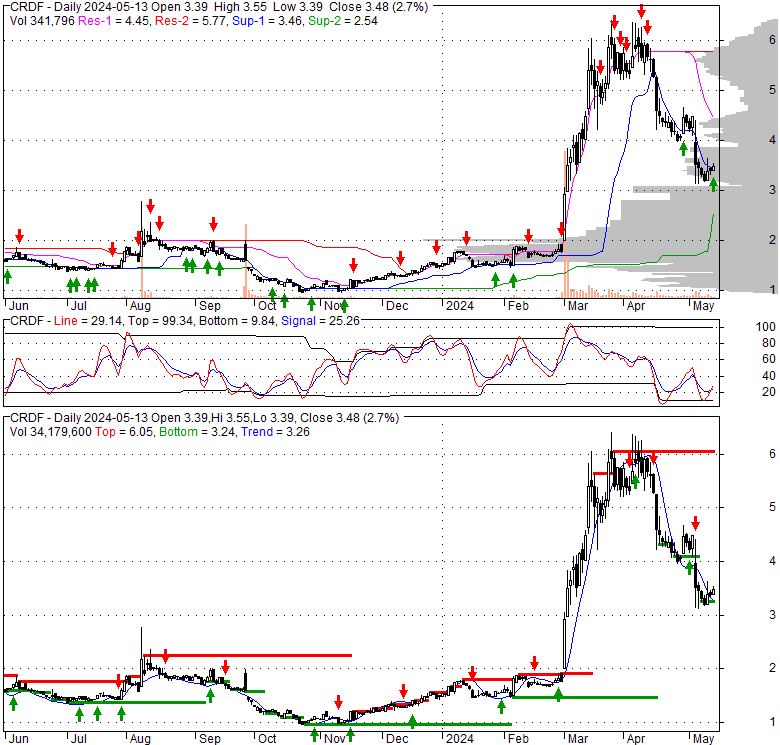
| Price has closed below its short-term moving average. Short-term moving average is currently below mid-term; and above long-term moving average. From the relationship between price and moving averages: This stock is BEARISH in short-term; and NEUTRAL in mid-long term.[ CRDF ] has closed above bottom band by 22.7%. Bollinger Bands are 124.2% wider than normal. The large width of the bands suggest high volatility as compared to its normal range. The bands have been in this wide range for 7 days. This is a sign that the current trend might continue. |
| Company profile |
|---|
| Cardiff Oncology, Inc., a clinical-stage oncology company, develops medicine treatment for cancer patients in California. Its lead drug candidate is onvansertib, an oral selective Polo-like Kinase 1 Inhibitor for anti-cancer therapeutics; CY140, an inhibitor of PLK1, PLK2, and PLK3 that is in phase 1/2 studies in solid tumors and leukemias; metastatic colorectal cancer that is in clinical trials; and TROV-054 is a Phase 1b/2 for FOLFIRI and bevacizumab. The company's TROV-053 is also in Phase II clinical trial in combination with Zytiga for metastatic castration-resistant prostate cancer. The company primarily serves pharmaceutical manufacturers. The company was formerly known as Trovagene, Inc. and changed its name to Cardiff Oncology, Inc. in May 2012. Cardiff Oncology, Inc. was incorporated in 1999 and is headquartered in San Diego, California. |
| Stock chart |
|---|
 |
| Financial Analysis | |
|---|---|
| Price to Book Value: | Underperform |
| P/BV, a ratio used to compare book value to its current market price, to gauge whether a stock is valued properly. | |
| Price to Earnings: | Underperform |
| PE, the ratio for valuing a company that measures its current share price relative to its earnings per share (EPS). | |
| Discounted cash flow: | Neutral |
| DCF, a valuation method used to estimate the value of an investment based on its expected future cash flows. | |
| Return on Assets: | Underperform |
| ROA, indicates how profitable a company is in relation to its total assets, how efficiently uses assets to generate a profit. | |
| Return on Equity: | Underperform |
| ROE, a measure of financial performance calculated by dividing net income by equity. a gauge of profitability and efficiency. | |
| Debt to Equity: | Neutral |
| evaluate financial leverage, reflects the ability of equity to cover outstanding debts in the event of a business downturn. | |
| Stock Basics & Statistics | |
|---|---|
| Exchange: NASDAQ Capital Market | |
| Sector: Healthcare | |
| Industry: Biotechnology | |
| Shares Out. (M) | |
| Shares Float (M) | 44.68 |
| % Held by Insiders | 41290000.00 |
| % Held by Institutions | 7.56 |
| Shares Short (K) | 1150 |
| Shares Short Prior Month (K) | |
| Stock Financials | |
|---|---|
| EPS | -45010000.000 |
| Book Value (p.s.) | |
| Profit Margin | |
| Operating Margin | -6.00 |
| Return on Assets (ttm) | 623.1 |
| Return on Equity (ttm) | -28.7 |
| Qtrly Rev. Growth | 488000.0 |
| Gross Profit (p.s.) | 11.117 |
| Sales Per Share | -23.893 |
| EBITDA (p.s.) | |
| Qtrly Earnings Growth | -0.93 |
| Operating Cash Flow (M) | |
| Levered Free Cash Flow (M) | -30.89 |
| Stock Valuation | |
|---|---|
| PE Ratio | |
| PEG Ratio | |
| Price to Book value | |
| Price to Sales | -0.17 |
| Price to Cash Flow | 5.14 |
| Stock Dividends | |
|---|---|
| Dividend | |
| Dividend Yield | |
| Dividend Growth | 3410000.000 |