| Corvus Pharma Com (CRVS) | |||
|---|---|---|---|
| 1.7905 -0.12 (-6.26%) | 05-07 10:34 | ||
| Open: | 1.81 | Pre. Close: | 1.91 |
| High: | 1.94 | Low: | 1.43 |
| Volume: | 723,172 | Market Cap: | 88(M) |
| Stock Technical Analysis | |
|---|---|
| Overall: |  |
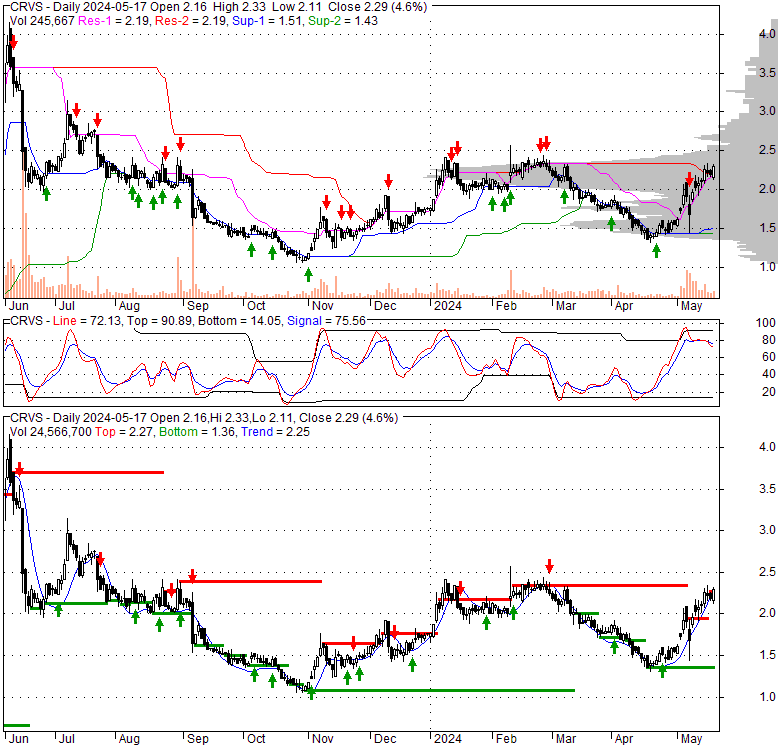
| Target: | Six months: 2.44 One year: 2.85 |
| Support: | Support1: 1.60 Support2: 1.30 |
| Resistance: | Resistance1: 2.09 Resistance2: 2.44 |
| Pivot: | 1.57 |
| Moving Averages: | MA(5): 1.78 MA(20): 1.56 MA(100): 1.91 MA(250): 1.98 |
| MACD: | MACD(12,26): 0.01 Signal(12,26,9): -0.05 |
| %K %D: | %K(14,3): 70.38 %D(3): 79.54 |
| RSI: | RSI(14): 53.31 |
| 52-Week: | High: 4.19 Low: 1.05 Change(%): 33.6 |
| Average Vol(K): | 3-Month: 221 10-Days: 310 |
| Prices Prediction (Update @5:00pm) | ||
|---|---|---|
| If tomorrow: | Open lower | Open higher |
| High: | 2.091 - 2.102 | 2.102 - 2.11 |
| Low: | 1.808 - 1.818 | 1.818 - 1.825 |
| Close: | 1.894 - 1.911 | 1.911 - 1.924 |
| Price, MAs and Bollinger Bands |
|---|
| Price has closed below its short-term moving average. Short-term moving average is currently above mid-term; and below long-term moving average. From the relationship between price and moving averages: This stock is NEUTRAL in short-term; and NEUTRAL in mid-long term.[ CRVS ] has closed below upper band by 27.1%. Bollinger Bands are 42.7% wider than normal. The large width of the bands suggest high volatility as compared to its normal range. The bands have been in this wide range for 1 days. This is a sign that the current trend might continue. |
| Company profile |
|---|
| Corvus Pharmaceuticals, Inc., a clinical stage biopharmaceutical company, focuses on the development and commercialization of immuno-oncology therapies. Its lead product candidate is Mupadolimab (CPI-006), an anti-CD73 monoclonal antibody, which is in Phase Ib/II clinical trial for non-small cell lung cancer and head and neck cancers. The company also develops CPI-818, a covalent inhibitor of ITK, which is in Phase I/Ib clinical trial to treat patients with various malignant T-cell lymphomas, as well as designed to inhibit the proliferation of certain malignant T-cells; and Ciforadenant (CPI-444), an oral, small molecule antagonist of the A2A receptor that is in Phase II clinical trial for patients with either advanced or refractory renal cell cancer. Its preclinical stage products include CPI-182, an antibody designed to block inflammation and myeloid suppression; and CPI-935, an adenosine A2B receptor antagonist to prevent fibrosis. Corvus Pharmaceuticals, Inc. has a strategic collaboration with Angel Pharmaceuticals for the development its pipeline of targeted investigational medicines. The company was incorporated in 2014 and is based in Burlingame, California. |
| Stock chart |
|---|
 |
| Financial Analysis | |
|---|---|
| Price to Book Value: | Neutral |
| P/BV, a ratio used to compare book value to its current market price, to gauge whether a stock is valued properly. | |
| Price to Earnings: | Underperform |
| PE, the ratio for valuing a company that measures its current share price relative to its earnings per share (EPS). | |
| Discounted cash flow: | Neutral |
| DCF, a valuation method used to estimate the value of an investment based on its expected future cash flows. | |
| Return on Assets: | Underperform |
| ROA, indicates how profitable a company is in relation to its total assets, how efficiently uses assets to generate a profit. | |
| Return on Equity: | Underperform |
| ROE, a measure of financial performance calculated by dividing net income by equity. a gauge of profitability and efficiency. | |
| Debt to Equity: | Underperform |
| evaluate financial leverage, reflects the ability of equity to cover outstanding debts in the event of a business downturn. | |
| Stock Basics & Statistics | |
|---|---|
| Exchange: NASDAQ Global Market | |
| Sector: Healthcare | |
| Industry: Biotechnology | |
| Shares Out. (M) | 49.04 |
| Shares Float (M) | 34.40 |
| % Held by Insiders | 3.91 |
| % Held by Institutions | 39.86 |
| Shares Short (K) | 1370 |
| Shares Short Prior Month (K) | 1490 |
| Stock Financials | |
|---|---|
| EPS | -0.560 |
| Book Value (p.s.) | 0.790 |
| Profit Margin | |
| Operating Margin | |
| Return on Assets (ttm) | -25.6 |
| Return on Equity (ttm) | -57.0 |
| Qtrly Rev. Growth | |
| Gross Profit (p.s.) | |
| Sales Per Share | |
| EBITDA (p.s.) | -0.473 |
| Qtrly Earnings Growth | |
| Operating Cash Flow (M) | -23.93 |
| Levered Free Cash Flow (M) | -15.79 |
| Stock Valuation | |
|---|---|
| PE Ratio | -3.09 |
| PEG Ratio | |
| Price to Book value | 2.19 |
| Price to Sales | |
| Price to Cash Flow | -3.55 |
| Stock Dividends | |
|---|---|
| Dividend | |
| Dividend Yield | |
| Dividend Growth | |


