| Discover Financial Services (DFS) | |||
|---|---|---|---|
| 126.705 -1.295 (-1.01%) | 04-30 15:59 | ||
| Open: | 127.13 | Pre. Close: | 128 |
| High: | 127.8 | Low: | 126.51 |
| Volume: | 994,762 | Market Cap: | 31,803(M) |
| Stock Technical Analysis | |
|---|---|
| Overall: |  |
| Target: | Six months: 153.77 One year: 179.60 |
| Support: | Support1: 124.02 Support2: 119.31 |
| Resistance: | Resistance1: 131.65 Resistance2: 153.77 |
| Pivot: | 124.73 |
| Moving Averages: | MA(5): 127.51 MA(20): 124.99 MA(100): 115.75 MA(250): 104.82 |
| MACD: | MACD(12,26): 1.22 Signal(12,26,9): 0.99 |
| %K %D: | %K(14,3): 73.83 %D(3): 71.85 |
| RSI: | RSI(14): 55.71 |
| 52-Week: | High: 131.65 Low: 79.04 Change(%): 33.6 |
| Average Vol(K): | 3-Month: 2018 10-Days: 1402 |
| Prices Prediction (Update @5:00pm) | ||
|---|---|---|
| If tomorrow: | Open lower | Open higher |
| High: | 128.65 - 129.144 | 129.144 - 129.712 |
| Low: | 125.805 - 126.344 | 126.344 - 126.963 |
| Close: | 127.002 - 127.863 | 127.863 - 128.854 |
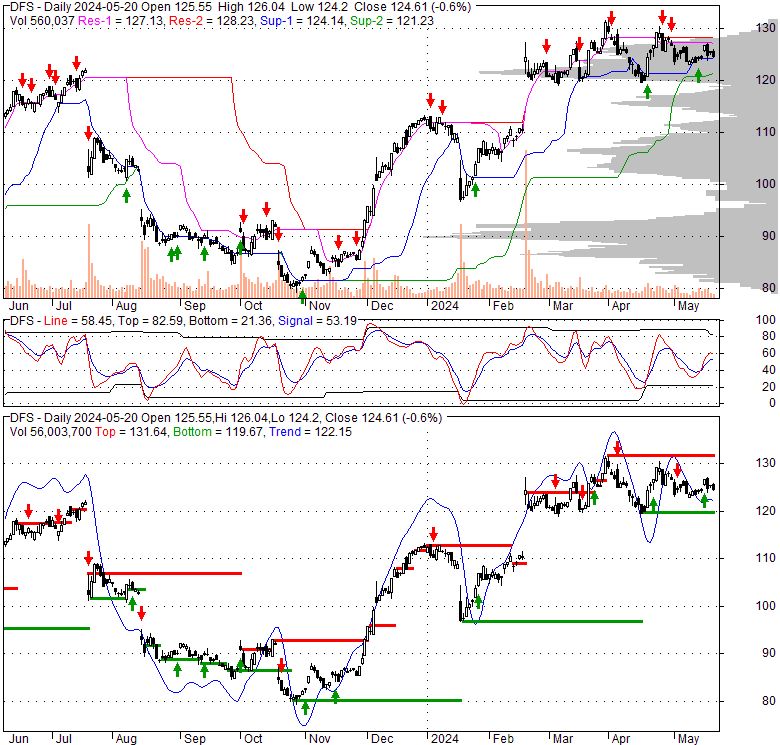
| Price, MAs and Bollinger Bands |
|---|
| Price has closed below its short-term moving average. Short-term moving average is currently above mid-term; and above long-term moving average. From the relationship between price and moving averages: This stock is NEUTRAL in short-term; and BULLISH in mid-long term.[ DFS ] has closed below upper band by 30.7%. Bollinger Bands are 13.4% narrower than normal. The current width of the bands does not suggest anything about the future direction or movement of prices. |
| Company profile |
|---|
| Discover Financial Services, through its subsidiaries, provides digital banking products and services, and payment services in the United States. It operates in two segments, Digital Banking and Payment Services. The Digital Banking segment offers Discover-branded credit cards to individuals; private student loans, personal loans, home loans, and other consumer lending; and direct-to-consumer deposit products comprising savings accounts, certificates of deposit, money market accounts, IRA certificates of deposit, IRA savings accounts and checking accounts, and sweep accounts. The Payment Services segment operates the PULSE, an automated teller machine, debit, and electronic funds transfer network; and Diners Club International, a payments network that issues Diners Club branded charge cards and/or provides card acceptance services, as well as offers payment transaction processing and settlement services. The company was incorporated in 1960 and is based in Riverwoods, Illinois. |
| Stock chart |
|---|
 |
| Financial Analysis | |
|---|---|
| Price to Book Value: | Outperform |
| P/BV, a ratio used to compare book value to its current market price, to gauge whether a stock is valued properly. | |
| Price to Earnings: | Outperform |
| PE, the ratio for valuing a company that measures its current share price relative to its earnings per share (EPS). | |
| Discounted cash flow: | Outperform |
| DCF, a valuation method used to estimate the value of an investment based on its expected future cash flows. | |
| Return on Assets: | Neutral |
| ROA, indicates how profitable a company is in relation to its total assets, how efficiently uses assets to generate a profit. | |
| Return on Equity: | Neutral |
| ROE, a measure of financial performance calculated by dividing net income by equity. a gauge of profitability and efficiency. | |
| Debt to Equity: | Outperform |
| evaluate financial leverage, reflects the ability of equity to cover outstanding debts in the event of a business downturn. | |
| Stock Basics & Statistics | |
|---|---|
| Exchange: New York Stock Exchange | |
| Sector: Financial Services | |
| Industry: Financial - Credit Services | |
| Shares Out. (M) | 250.56 |
| Shares Float (M) | 249.40 |
| % Held by Insiders | 0.57 |
| % Held by Institutions | 88.78 |
| Shares Short (K) | 2830 |
| Shares Short Prior Month (K) | 2770 |
| Stock Financials | |
|---|---|
| EPS | 8.770 |
| Book Value (p.s.) | 58.650 |
| Profit Margin | 23.03 |
| Operating Margin | 11.83 |
| Return on Assets (ttm) | 1.6 |
| Return on Equity (ttm) | 15.7 |
| Qtrly Rev. Growth | 29.4 |
| Gross Profit (p.s.) | |
| Sales Per Share | 39.511 |
| EBITDA (p.s.) | |
| Qtrly Earnings Growth | -69.10 |
| Operating Cash Flow (M) | |
| Levered Free Cash Flow (M) | |
| Stock Valuation | |
|---|---|
| PE Ratio | 14.50 |
| PEG Ratio | -1.61 |
| Price to Book value | 2.17 |
| Price to Sales | 3.22 |
| Price to Cash Flow | |
| Stock Dividends | |
|---|---|
| Dividend | |
| Dividend Yield | |
| Dividend Growth | |


