| Quest Diagnostics Inc (DGX) | |||
|---|---|---|---|
| 137.38 1.04 (0.76%) | 05-03 16:00 | ||
| Open: | 136.66 | Pre. Close: | 136.34 |
| High: | 137.46 | Low: | 135.265 |
| Volume: | 629,023 | Market Cap: | 15,262(M) |
| Stock Technical Analysis | |
|---|---|
| Overall: |  |
| Target: | Six months: 166.39 One year: 194.35 |
| Support: | Support1: 131.93 Support2: 125.42 |
| Resistance: | Resistance1: 142.46 Resistance2: 166.39 |
| Pivot: | 133.36 |
| Moving Averages: | MA(5): 137.79 MA(20): 132.67 MA(100): 131.49 MA(250): 132.18 |
| MACD: | MACD(12,26): 2.15 Signal(12,26,9): 1.61 |
| %K %D: | %K(14,3): 68.49 %D(3): 71.59 |
| RSI: | RSI(14): 60.19 |
| 52-Week: | High: 145.58 Low: 119.59 Change(%): 0.6 |
| Average Vol(K): | 3-Month: 992 10-Days: 1234 |
| Prices Prediction (Update @5:00pm) | ||
|---|---|---|
| If tomorrow: | Open lower | Open higher |
| High: | 137.525 - 138.355 | 138.355 - 139.151 |
| Low: | 133.289 - 134.27 | 134.27 - 135.21 |
| Close: | 135.869 - 137.321 | 137.321 - 138.713 |
| Price, MAs and Bollinger Bands |
|---|
| Price has closed below its short-term moving average. Short-term moving average is currently above mid-term; and above long-term moving average. From the relationship between price and moving averages: This stock is NEUTRAL in short-term; and NEUTRAL in mid-long term.[ DGX ] has closed below upper band by 28.4%. Bollinger Bands are 110.4% wider than normal. The large width of the bands suggest high volatility as compared to its normal range. The bands have been in this wide range for 7 days. This is a sign that the current trend might continue. |
| Company profile |
|---|
| Quest Diagnostics Incorporated provides diagnostic testing, information, and services in the United States and internationally. The company develops and delivers diagnostic information services, such as routine testing, non-routine and advanced clinical testing, anatomic pathology testing, and other diagnostic information services. It offers diagnostic information services primarily under the Quest Diagnostics brand, as well as under the AmeriPath, Dermpath Diagnostics, ExamOne, and Quanum brands to patients, clinicians, hospitals, independent delivery networks, health plans, employers, direct contract entities, and accountable care organizations through a network of laboratories, patient service centers, phlebotomists in physician offices, call centers and mobile paramedics, nurses, and other health and wellness professionals. The company also provides risk assessment services for the life insurance industry; and healthcare organizations and clinicians robust information technology solutions. Quest Diagnostics Incorporated was founded in 1967 and is headquartered in Secaucus, New Jersey. |
| Stock chart |
|---|
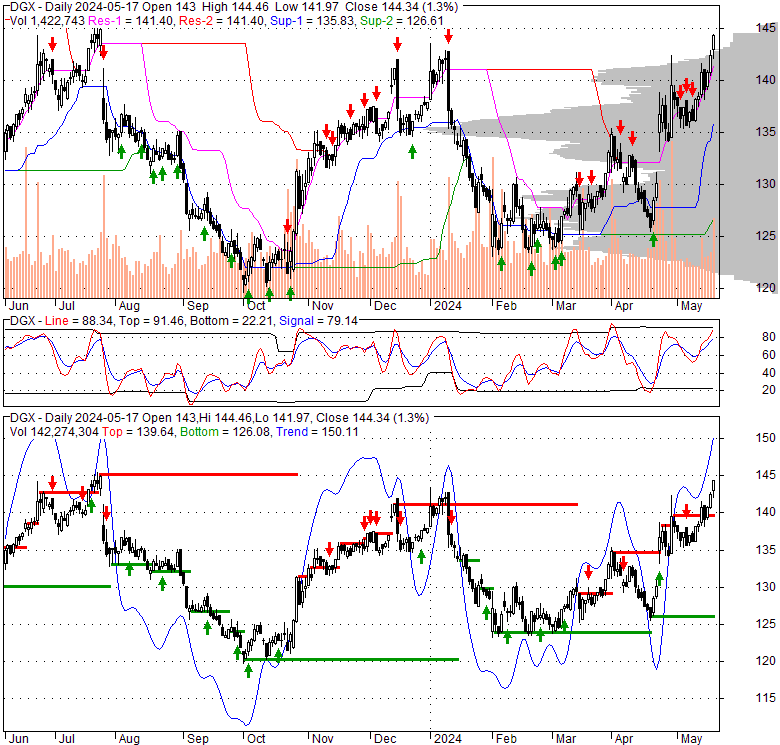 |
| Financial Analysis | |
|---|---|
| Price to Book Value: | Neutral |
| P/BV, a ratio used to compare book value to its current market price, to gauge whether a stock is valued properly. | |
| Price to Earnings: | Outperform |
| PE, the ratio for valuing a company that measures its current share price relative to its earnings per share (EPS). | |
| Discounted cash flow: | Outperform |
| DCF, a valuation method used to estimate the value of an investment based on its expected future cash flows. | |
| Return on Assets: | Outperform |
| ROA, indicates how profitable a company is in relation to its total assets, how efficiently uses assets to generate a profit. | |
| Return on Equity: | Outperform |
| ROE, a measure of financial performance calculated by dividing net income by equity. a gauge of profitability and efficiency. | |
| Debt to Equity: | Outperform |
| evaluate financial leverage, reflects the ability of equity to cover outstanding debts in the event of a business downturn. | |
| Stock Basics & Statistics | |
|---|---|
| Exchange: New York Stock Exchange | |
| Sector: Healthcare | |
| Industry: Medical - Diagnostics & Research | |
| Shares Out. (M) | 111.06 |
| Shares Float (M) | 109.71 |
| % Held by Insiders | 0.43 |
| % Held by Institutions | 91.80 |
| Shares Short (K) | 2550 |
| Shares Short Prior Month (K) | 2750 |
| Stock Financials | |
|---|---|
| EPS | 7.490 |
| Book Value (p.s.) | 56.820 |
| Profit Margin | 9.23 |
| Operating Margin | 12.94 |
| Return on Assets (ttm) | 6.2 |
| Return on Equity (ttm) | 14.6 |
| Qtrly Rev. Growth | -1.9 |
| Gross Profit (p.s.) | |
| Sales Per Share | 83.288 |
| EBITDA (p.s.) | 15.937 |
| Qtrly Earnings Growth | 86.80 |
| Operating Cash Flow (M) | 1270.00 |
| Levered Free Cash Flow (M) | 662.88 |
| Stock Valuation | |
|---|---|
| PE Ratio | 18.34 |
| PEG Ratio | 2.76 |
| Price to Book value | 2.42 |
| Price to Sales | 1.65 |
| Price to Cash Flow | 12.01 |
| Stock Dividends | |
|---|---|
| Dividend | |
| Dividend Yield | |
| Dividend Growth | |


