| Dish Network Corp (DISH) | |||
|---|---|---|---|
| 5.77 0.11 (1.94%) | 12-29 16:00 | ||
| Open: | 5.64 | Pre. Close: | 5.66 |
| High: | 5.963 | Low: | 5.57 |
| Volume: | 50,815,955 | Market Cap: | 3,083(M) |
| Stock Technical Analysis | |
|---|---|
| Overall: |  |
| Target: | Six months: 6.96 One year: 8.13 |
| Support: | Support1: 4.46 Support2: 3.53 |
| Resistance: | Resistance1: 5.96 Resistance2: 6.96 |
| Pivot: | 5.16 |
| Moving Averages: | MA(5): 5.75 MA(20): 4.95 MA(100): 5.15 MA(250): 7.62 |
| MACD: | MACD(12,26): 0.42 Signal(12,26,9): 0.32 |
| %K %D: | %K(14,3): 89.70 %D(3): 90.23 |
| RSI: | RSI(14): 75.61 |
| 52-Week: | High: 15.96 Low: 3.21 Change(%): -61.6 |
| Average Vol(K): | 3-Month: 9848 10-Days: 10017 |
| Prices Prediction (Update @5:00pm) | ||
|---|---|---|
| If tomorrow: | Open lower | Open higher |
| High: | 5.778 - 5.808 | 5.808 - 5.832 |
| Low: | 5.701 - 5.733 | 5.733 - 5.759 |
| Close: | 5.724 - 5.773 | 5.773 - 5.813 |
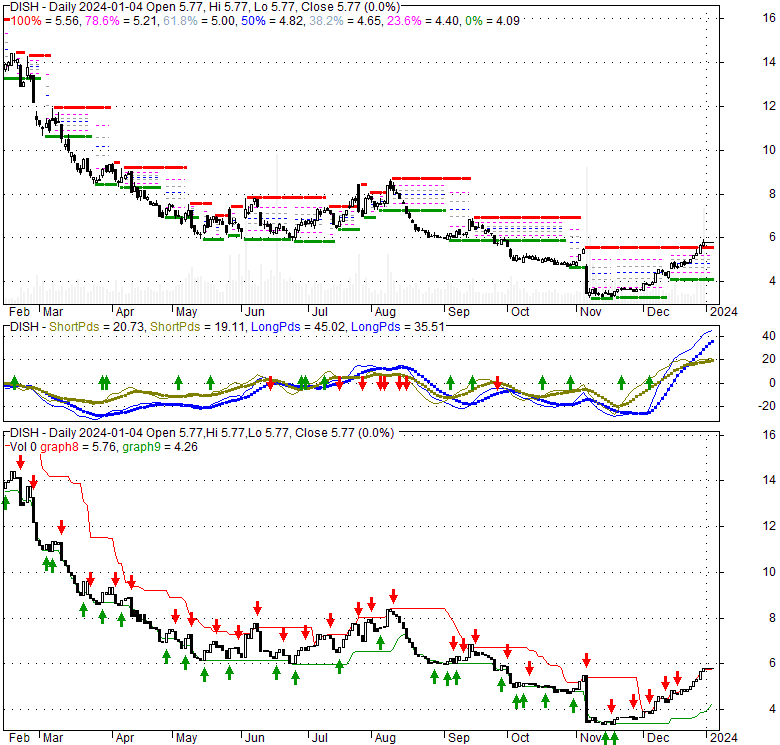
| Price, MAs and Bollinger Bands |
|---|
| Price has closed above its short-term moving average. Short-term moving average is currently above mid-term; and above long-term moving average. From the relationship between price and moving averages: This stock is BULLISH in short-term; and NEUTRAL in mid-long term.[ DISH ] has closed below upper band by 17.0%. Bollinger Bands are 20.8% wider than normal. The current width of the bands does not suggest anything about the future direction or movement of prices. |
| Company profile |
|---|
| DISH Network Corporation, together with its subsidiaries, provides pay-TV services in the United States. The company operates in two segments, Pay-TV and Wireless. It offers video services under the DISH TV brand; and programming packages that include programming through national broadcast networks, local broadcast networks, and national and regional cable networks, as well as regional and specialty sports channels, premium movie channels, and Latino and international programming packages. The company also provides access to movies and television shows through TV or Internet-connected devices; and dishanywhere.com and mobile applications on Internet-connected devices to view authorized content, search program listings, and remotely control certain features of their DVRs. In addition, it offers Sling TV services, including Sling domestic, Sling International, Sling Latino, Sling Orange, and Sling Blue services that require an Internet connection and are available on streaming-capable devices, such as streaming media devices, TVs, tablets, computers, game consoles, and phones, as well as market SLING TV services to consumers who do not subscribe to traditional satellite and cable pay-TV services. Further, the company provides wireless subscribers consumer plans with no annual service contracts, as well as monthly service plans, including high-speed data and unlimited talk and text. As of December 31, 2021, it had 10.707 million pay-TV subscribers in the United States, including 8.221 million DISH TV subscribers and 2.486 million SLING TV subscribers. The company offers receiver systems and programming through direct sales channels, as well as independent third parties, such as small retailers, direct marketing groups, local and regional consumer electronics stores, retailers, and telecommunications companies. DISH Network Corporation was founded in 1980 and is headquartered in Englewood, Colorado. |
| Stock chart |
|---|
 |
| Financial Analysis | |
|---|---|
| Price to Book Value: | Neutral |
| P/BV, a ratio used to compare book value to its current market price, to gauge whether a stock is valued properly. | |
| Price to Earnings: | Underperform |
| PE, the ratio for valuing a company that measures its current share price relative to its earnings per share (EPS). | |
| Discounted cash flow: | Outperform |
| DCF, a valuation method used to estimate the value of an investment based on its expected future cash flows. | |
| Return on Assets: | Underperform |
| ROA, indicates how profitable a company is in relation to its total assets, how efficiently uses assets to generate a profit. | |
| Return on Equity: | Underperform |
| ROE, a measure of financial performance calculated by dividing net income by equity. a gauge of profitability and efficiency. | |
| Debt to Equity: | Outperform |
| evaluate financial leverage, reflects the ability of equity to cover outstanding debts in the event of a business downturn. | |
| Stock Basics & Statistics | |
|---|---|
| Exchange: NASDAQ Global Select | |
| Sector: Communication Services | |
| Industry: Telecommunications Services | |
| Shares Out. (M) | 295.96 |
| Shares Float (M) | 247.34 |
| % Held by Insiders | 16.36 |
| % Held by Institutions | 83.98 |
| Shares Short (K) | 51930 |
| Shares Short Prior Month (K) | 54370 |
| Stock Financials | |
|---|---|
| EPS | 1.900 |
| Book Value (p.s.) | 34.210 |
| Profit Margin | 7.81 |
| Operating Margin | -1.13 |
| Return on Assets (ttm) | |
| Return on Equity (ttm) | 7.2 |
| Qtrly Rev. Growth | -9.5 |
| Gross Profit (p.s.) | 17.942 |
| Sales Per Share | 52.777 |
| EBITDA (p.s.) | 6.116 |
| Qtrly Earnings Growth | |
| Operating Cash Flow (M) | 2670.00 |
| Levered Free Cash Flow (M) | -2460.00 |
| Stock Valuation | |
|---|---|
| PE Ratio | 3.04 |
| PEG Ratio | -0.46 |
| Price to Book value | 0.17 |
| Price to Sales | 0.11 |
| Price to Cash Flow | 0.64 |
| Stock Dividends | |
|---|---|
| Dividend | |
| Dividend Yield | |
| Dividend Growth | |


