| Diversey Holdings Ltd (DSEY) | |||
|---|---|---|---|
| 8.395 0.005 (0.06%) | 07-05 15:59 | ||
| Open: | 8.39 | Pre. Close: | 8.39 |
| High: | 8.4 | Low: | 8.39 |
| Volume: | 1,131,694 | Market Cap: | 2,725(M) |
| Stock Technical Analysis | |
|---|---|
| Overall: |  |
| Target: | Six months: 9.81 One year: 11.46 |
| Support: | Support1: 8.33 Support2: 8.28 |
| Resistance: | Resistance1: 8.40 Resistance2: 9.81 |
| Pivot: | 8.38 |
| Moving Averages: | MA(5): 8.39 MA(20): 8.37 MA(100): 7.83 MA(250): 6.48 |
| MACD: | MACD(12,26): 0.03 Signal(12,26,9): 0.03 |
| %K %D: | %K(14,3): 89.52 %D(3): 90.72 |
| RSI: | RSI(14): 63.80 |
| 52-Week: | High: 8.41 Low: 3.95 Change(%): 33.2 |
| Average Vol(K): | 3-Month: 1994 10-Days: 1431 |
| Prices Prediction (Update @5:00pm) | ||
|---|---|---|
| If tomorrow: | Open lower | Open higher |
| High: | 8.4 - 8.444 | 8.444 - 8.482 |
| Low: | 8.283 - 8.334 | 8.334 - 8.378 |
| Close: | 8.306 - 8.393 | 8.393 - 8.466 |
| Price, MAs and Bollinger Bands |
|---|
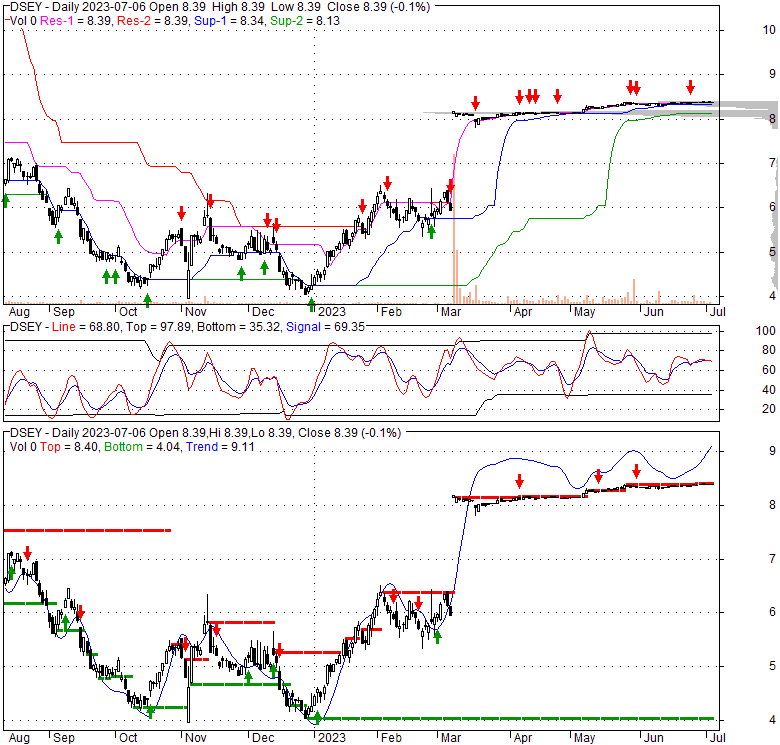
| Price has closed below its short-term moving average. Short-term moving average is currently above mid-term; and above long-term moving average. From the relationship between price and moving averages: This stock is NEUTRAL in short-term; and BULLISH in mid-long term.[ DSEY ] has closed below upper band by 26.7%. Bollinger Bands are 91.4% narrower than normal. The narrow width of the bands suggests low volatility as compared to its normal range. The bands have been in this narrow range for 68 bars. This is a sign that the market may be about to initiate a new trend. |
| Company profile |
|---|
| Diversey Holdings, Ltd., through its subsidiaries, provides infection prevention and cleaning solutions worldwide. It operates in two segments, Institutional, and Food & Beverage. The Institutional segment offers products, solutions, equipment, and machines, including infection prevention and personal care products, floor and building care chemicals, kitchen and mechanical ware wash chemicals and machines, dosing and dispensing equipment, and floor care machines, as well as engineering, consulting, and training services related to productivity management, water and energy management, and risk management. This segment serves customers in the healthcare, education, food service, retail and grocery, hospitality, and building service contractors industries. The Food & Beverage segment provides a range of products, solutions, equipment, and machines, such as chemical products, engineering and equipment solutions, knowledge-based services, training through its Diversey Hygiene Academy, and water treatment. This segment serves customers in the brewing, beverage, dairy, processed foods, pharma, and agriculture industries. Diversey Holdings, Ltd. was founded in 1923 and is headquartered in Fort Mill, South Carolina. |
| Stock chart |
|---|
 |
| Stock News |
|---|
|
Tue, 30 Apr 2024 AXTA or DSEY: Which Is the Better Value Stock Right Now? - Yahoo Movies UK Thu, 04 May 2023 Diversey Holdings, Ltd. (DSEY) Reports Break-Even Earnings for Q1 - Yahoo Finance Thu, 04 May 2023 Diversey Reports First Quarter 2023 Results - GlobeNewswire Tue, 02 May 2023 Diversey Holdings: Potential For 3.19% Upside In A Month Or Two - Seeking Alpha Fri, 17 Mar 2023 Diversey Reports Fourth Quarter and Full Year 2022 Results - GlobeNewswire Wed, 08 Mar 2023 Diversey to be Acquired by Solenis for $4.6 Billion - citybiz |
| Financial Analysis | |
|---|---|
| Price to Book Value: | Outperform |
| P/BV, a ratio used to compare book value to its current market price, to gauge whether a stock is valued properly. | |
| Price to Earnings: | Underperform |
| PE, the ratio for valuing a company that measures its current share price relative to its earnings per share (EPS). | |
| Discounted cash flow: | Neutral |
| DCF, a valuation method used to estimate the value of an investment based on its expected future cash flows. | |
| Return on Assets: | Underperform |
| ROA, indicates how profitable a company is in relation to its total assets, how efficiently uses assets to generate a profit. | |
| Return on Equity: | Underperform |
| ROE, a measure of financial performance calculated by dividing net income by equity. a gauge of profitability and efficiency. | |
| Debt to Equity: | Outperform |
| evaluate financial leverage, reflects the ability of equity to cover outstanding debts in the event of a business downturn. | |
| Stock Basics & Statistics | |
|---|---|
| Exchange: NASDAQ Global Select | |
| Sector: Consumer Cyclical | |
| Industry: Personal Products & Services | |
| Shares Out. (M) | 324.58 |
| Shares Float (M) | 77.09 |
| % Held by Insiders | 3.02 |
| % Held by Institutions | 95.63 |
| Shares Short (K) | 12190 |
| Shares Short Prior Month (K) | 6060 |
| Stock Financials | |
|---|---|
| EPS | -0.580 |
| Book Value (p.s.) | 1.940 |
| Profit Margin | -6.56 |
| Operating Margin | 3.00 |
| Return on Assets (ttm) | 1.2 |
| Return on Equity (ttm) | -26.2 |
| Qtrly Rev. Growth | 5.5 |
| Gross Profit (p.s.) | 2.964 |
| Sales Per Share | 8.627 |
| EBITDA (p.s.) | 0.803 |
| Qtrly Earnings Growth | |
| Operating Cash Flow (M) | -54.60 |
| Levered Free Cash Flow (M) | 71.29 |
| Stock Valuation | |
|---|---|
| PE Ratio | -14.47 |
| PEG Ratio | 1.62 |
| Price to Book value | 4.32 |
| Price to Sales | 0.97 |
| Price to Cash Flow | -49.88 |
| Stock Dividends | |
|---|---|
| Dividend | |
| Dividend Yield | |
| Dividend Growth | |