| Duke Energy Corp (DUK) | |||
|---|---|---|---|
| 97.71 -1.32 (-1.33%) | 04-26 16:00 | ||
| Open: | 99 | Pre. Close: | 99.03 |
| High: | 99.22 | Low: | 97.62 |
| Volume: | 1,930,622 | Market Cap: | 75,379(M) |
| Stock Technical Analysis | |
|---|---|
| Overall: |  |
| Target: | Six months: 116.34 One year: 135.88 |
| Support: | Support1: 95.37 Support2: 92.75 |
| Resistance: | Resistance1: 99.61 Resistance2: 116.34 |
| Pivot: | 96.46 |
| Moving Averages: | MA(5): 98.40 MA(20): 96.38 MA(100): 95.36 MA(250): 92.81 |
| MACD: | MACD(12,26): 0.90 Signal(12,26,9): 0.62 |
| %K %D: | %K(14,3): 86.82 %D(3): 90.17 |
| RSI: | RSI(14): 57.07 |
| 52-Week: | High: 100.13 Low: 83.06 Change(%): -1.2 |
| Average Vol(K): | 3-Month: 2962 10-Days: 2476 |
| Prices Prediction (Update @5:00pm) | ||
|---|---|---|
| If tomorrow: | Open lower | Open higher |
| High: | 99.277 - 99.784 | 99.784 - 100.173 |
| Low: | 96.432 - 96.968 | 96.968 - 97.379 |
| Close: | 96.87 - 97.76 | 97.76 - 98.443 |
| Price, MAs and Bollinger Bands |
|---|
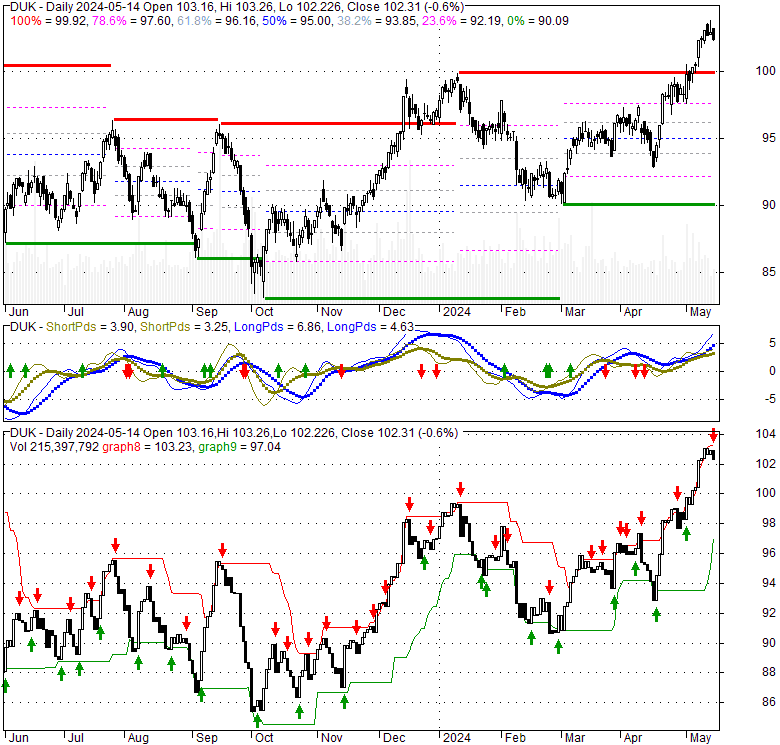
| Price has closed below its short-term moving average. Short-term moving average is currently above mid-term; and above long-term moving average. From the relationship between price and moving averages: This stock is NEUTRAL in short-term; and NEUTRAL in mid-long term.[ DUK ] has closed below upper band by 33.1%. Bollinger Bands are 40.5% wider than normal. The large width of the bands suggest high volatility as compared to its normal range. The bands have been in this wide range for 0 days. This is a sign that the current trend might continue. |
| Company profile |
|---|
| Duke Energy Corporation, together with its subsidiaries, operates as an energy company in the United States. It operates through three segments: Electric Utilities and Infrastructure, Gas Utilities and Infrastructure, and Commercial Renewables. The Electric Utilities and Infrastructure segment generates, transmits, distributes, and sells electricity in the Carolinas, Florida, and the Midwest; and uses coal, hydroelectric, natural gas, oil, renewable generation, and nuclear fuel to generate electricity. It also engages in the wholesale of electricity to municipalities, electric cooperative utilities, and load-serving entities. This segment serves approximately 8.2 million customers in 6 states in the Southeast and Midwest regions of the United States covering a service territory of approximately 91,000 square miles; and owns approximately 50,259 megawatts (MW) of generation capacity. The Gas Utilities and Infrastructure segment distributes natural gas to residential, commercial, industrial, and power generation natural gas customers; and owns, operates, and invests in pipeline transmission and natural gas storage facilities. It has approximately 1.6 million customers, including 1.1 million customers in North Carolina, South Carolina, and Tennessee, as well as 550,000 customers in southwestern Ohio and northern Kentucky. The Commercial Renewables segment acquires, owns, develops, builds, and operates wind and solar renewable generation projects, including nonregulated renewable energy and energy storage services to utilities, electric cooperatives, municipalities, and corporate customers. It has 23 wind, 178 solar, and 2 battery storage facilities, as well as 71 fuel cell locations with a capacity of 3,554 MW across 22 states. The company was formerly known as Duke Energy Holding Corp. and changed its name to Duke Energy Corporation in April 2005. The company was founded in 1904 and is headquartered in Charlotte, North Carolina. |
| Stock chart |
|---|
 |
| Financial Analysis | |
|---|---|
| Price to Book Value: | Outperform |
| P/BV, a ratio used to compare book value to its current market price, to gauge whether a stock is valued properly. | |
| Price to Earnings: | Outperform |
| PE, the ratio for valuing a company that measures its current share price relative to its earnings per share (EPS). | |
| Discounted cash flow: | Outperform |
| DCF, a valuation method used to estimate the value of an investment based on its expected future cash flows. | |
| Return on Assets: | Underperform |
| ROA, indicates how profitable a company is in relation to its total assets, how efficiently uses assets to generate a profit. | |
| Return on Equity: | Underperform |
| ROE, a measure of financial performance calculated by dividing net income by equity. a gauge of profitability and efficiency. | |
| Debt to Equity: | Outperform |
| evaluate financial leverage, reflects the ability of equity to cover outstanding debts in the event of a business downturn. | |
| Stock Basics & Statistics | |
|---|---|
| Exchange: New York Stock Exchange | |
| Sector: Utilities | |
| Industry: Regulated Electric | |
| Shares Out. (M) | 771.46 |
| Shares Float (M) | 768.77 |
| % Held by Insiders | 0.14 |
| % Held by Institutions | 66.62 |
| Shares Short (K) | 8400 |
| Shares Short Prior Month (K) | 9170 |
| Stock Financials | |
|---|---|
| EPS | 5.350 |
| Book Value (p.s.) | 61.150 |
| Profit Margin | 9.93 |
| Operating Margin | 28.72 |
| Return on Assets (ttm) | 2.5 |
| Return on Equity (ttm) | 8.5 |
| Qtrly Rev. Growth | -2.1 |
| Gross Profit (p.s.) | |
| Sales Per Share | 37.073 |
| EBITDA (p.s.) | 17.227 |
| Qtrly Earnings Growth | |
| Operating Cash Flow (M) | 9880.00 |
| Levered Free Cash Flow (M) | -4370.00 |
| Stock Valuation | |
|---|---|
| PE Ratio | 18.26 |
| PEG Ratio | 2.34 |
| Price to Book value | 1.60 |
| Price to Sales | 2.63 |
| Price to Cash Flow | 7.63 |
| Stock Dividends | |
|---|---|
| Dividend | |
| Dividend Yield | |
| Dividend Growth | |