| Eagle Bancorp Inc (EGBN) | |||
|---|---|---|---|
| 20.03 0.24 (1.21%) | 05-03 16:00 | ||
| Open: | 20.26 | Pre. Close: | 19.79 |
| High: | 20.43 | Low: | 20.01 |
| Volume: | 233,461 | Market Cap: | 599(M) |
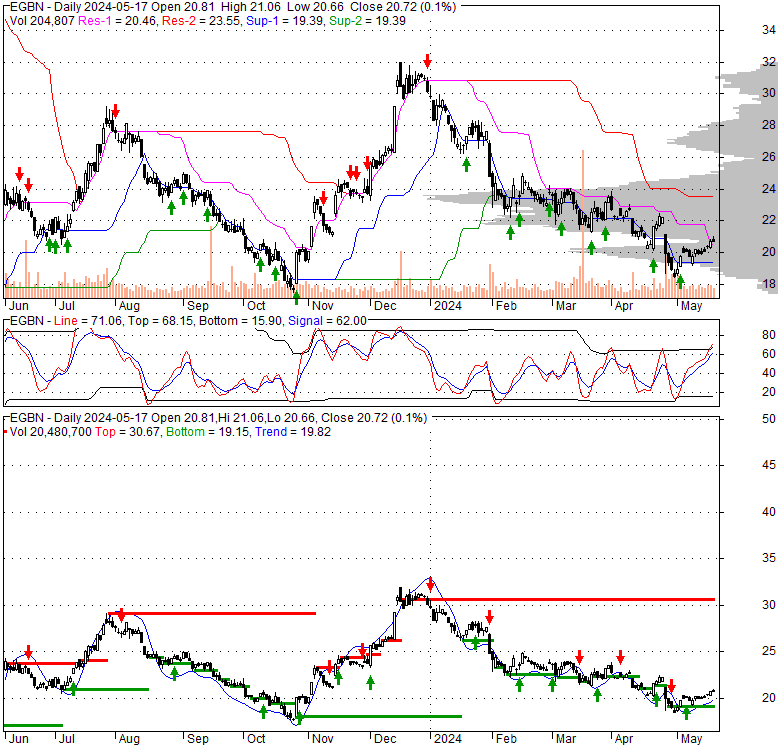
| Stock Technical Analysis | |
|---|---|
| Overall: |  |
| Target: | Six months: 25.49 One year: 27.96 |
| Support: | Support1: 18.40 Support2: 15.31 |
| Resistance: | Resistance1: 21.82 Resistance2: 23.94 |
| Pivot: | 20.45 |
| Moving Averages: | MA(5): 19.25 MA(20): 20.79 MA(100): 24.58 MA(250): 23.40 |
| MACD: | MACD(12,26): -0.80 Signal(12,26,9): -0.71 |
| %K %D: | %K(14,3): 28.84 %D(3): 17.67 |
| RSI: | RSI(14): 43.02 |
| 52-Week: | High: 31.97 Low: 16.72 Change(%): -2.9 |
| Average Vol(K): | 3-Month: 326 10-Days: 384 |
| Prices Prediction (Update @5:00pm) | ||
|---|---|---|
| If tomorrow: | Open lower | Open higher |
| High: | 20.461 - 20.543 | 20.543 - 20.628 |
| Low: | 19.808 - 19.893 | 19.893 - 19.981 |
| Close: | 19.891 - 20.038 | 20.038 - 20.19 |
| Price, MAs and Bollinger Bands |
|---|
| Price has closed above its short-term moving average. Short-term moving average is currently below mid-term; and below long-term moving average. From the relationship between price and moving averages: This stock is NEUTRAL in short-term; and BEARISH in mid-long term.[ EGBN ] has closed above bottom band by 41.1%. Bollinger Bands are 13.4% wider than normal. The current width of the bands does not suggest anything about the future direction or movement of prices. |
| Company profile |
|---|
| Eagle Bancorp, Inc. operates as the bank holding company for EagleBank that provides commercial and consumer banking services primarily in the United States. The company also offers various commercial and consumer lending products comprising commercial loans for working capital, equipment purchases, real estate lines of credit, and government contract financing; asset based lending and accounts receivable financing; construction and commercial real estate loans; business equipment financing; consumer home equity lines of credit, personal lines of credit, and term loans; consumer installment loans, such as auto and personal loans; personal credit cards; and residential mortgage loans. In addition, it provides online and mobile banking services; and other services, including cash management services, business sweep accounts, lock boxes, remote deposit captures, account reconciliation services, merchant card services, safety deposit boxes, and automated clearing house origination, as well as after-hours depositories and ATM services. Further, the company offers insurance products and services through a referral program. The company serves sole proprietors, small and medium-sized businesses, partnerships, corporations, non-profit organizations and associations, and individuals, as well as investors. As of December 31, 2021, it operated seventeen banking offices comprising 6 in Suburban Maryland, 5 in the District of Columbia, and 6 in Northern Virginia. Eagle Bancorp, Inc. was incorporated in 1997 and is headquartered in Bethesda, Maryland. |
| Stock chart |
|---|
 |
| Financial Analysis | |
|---|---|
| Price to Book Value: | Underperform |
| P/BV, a ratio used to compare book value to its current market price, to gauge whether a stock is valued properly. | |
| Price to Earnings: | Underperform |
| PE, the ratio for valuing a company that measures its current share price relative to its earnings per share (EPS). | |
| Discounted cash flow: | Underperform |
| DCF, a valuation method used to estimate the value of an investment based on its expected future cash flows. | |
| Return on Assets: | Underperform |
| ROA, indicates how profitable a company is in relation to its total assets, how efficiently uses assets to generate a profit. | |
| Return on Equity: | Underperform |
| ROE, a measure of financial performance calculated by dividing net income by equity. a gauge of profitability and efficiency. | |
| Debt to Equity: | Outperform |
| evaluate financial leverage, reflects the ability of equity to cover outstanding debts in the event of a business downturn. | |
| Stock Basics & Statistics | |
|---|---|
| Exchange: NASDAQ Capital Market | |
| Sector: Financial Services | |
| Industry: Banks - Regional | |
| Shares Out. (M) | 30.19 |
| Shares Float (M) | 28.93 |
| % Held by Insiders | 3.20 |
| % Held by Institutions | 78.46 |
| Shares Short (K) | 2110 |
| Shares Short Prior Month (K) | 2170 |
| Stock Financials | |
|---|---|
| EPS | 3.310 |
| Book Value (p.s.) | 42.580 |
| Profit Margin | 35.80 |
| Operating Margin | 47.32 |
| Return on Assets (ttm) | 0.9 |
| Return on Equity (ttm) | 8.0 |
| Qtrly Rev. Growth | -32.1 |
| Gross Profit (p.s.) | |
| Sales Per Share | 9.301 |
| EBITDA (p.s.) | |
| Qtrly Earnings Growth | -48.90 |
| Operating Cash Flow (M) | 195.63 |
| Levered Free Cash Flow (M) | |
| Stock Valuation | |
|---|---|
| PE Ratio | 6.05 |
| PEG Ratio | 1.18 |
| Price to Book value | 0.47 |
| Price to Sales | 2.15 |
| Price to Cash Flow | 3.09 |
| Stock Dividends | |
|---|---|
| Dividend | 0.450 |
| Dividend Yield | 0.02 |
| Dividend Growth | |


