| Farfetch Ltd Cl A (FTCH) | |||
|---|---|---|---|
| 0.6428 -0.098 (-13.26%) | 12-15 16:00 | ||
| Open: | 0.7591 | Pre. Close: | 0.7411 |
| High: | 0.762 | Low: | 0.64 |
| Volume: | 36,467,567 | Market Cap: | 254(M) |
| Stock Technical Analysis | |
|---|---|
| Overall: |  |
| Target: | Six months: 0.11 One year: 0.16 |
| Support: | Support1: 0.01 Support2: 0.01 |
| Resistance: | Resistance1: 0.09 Resistance2: 0.14 |
| Pivot: | 0.04 |
| Moving Averages: | MA(5): 0.03 MA(20): 0.05 MA(100): 1.15 MA(250): 3.36 |
| MACD: | MACD(12,26): -0.11 Signal(12,26,9): -0.14 |
| %K %D: | %K(14,3): 11.23 %D(3): 10.95 |
| RSI: | RSI(14): 29.21 |
| 52-Week: | High: 8.02 Low: 0.53 Change(%): -99.6 |
| Average Vol(K): | 3-Month: 21592 10-Days: 3926 |
| Prices Prediction (Update @5:00pm) | ||
|---|---|---|
| If tomorrow: | Open lower | Open higher |
| High: | 0.03 - 0.03 | 0.03 - 0.03 |
| Low: | 0.02 - 0.02 | 0.02 - 0.02 |
| Close: | 0.03 - 0.03 | 0.03 - 0.03 |
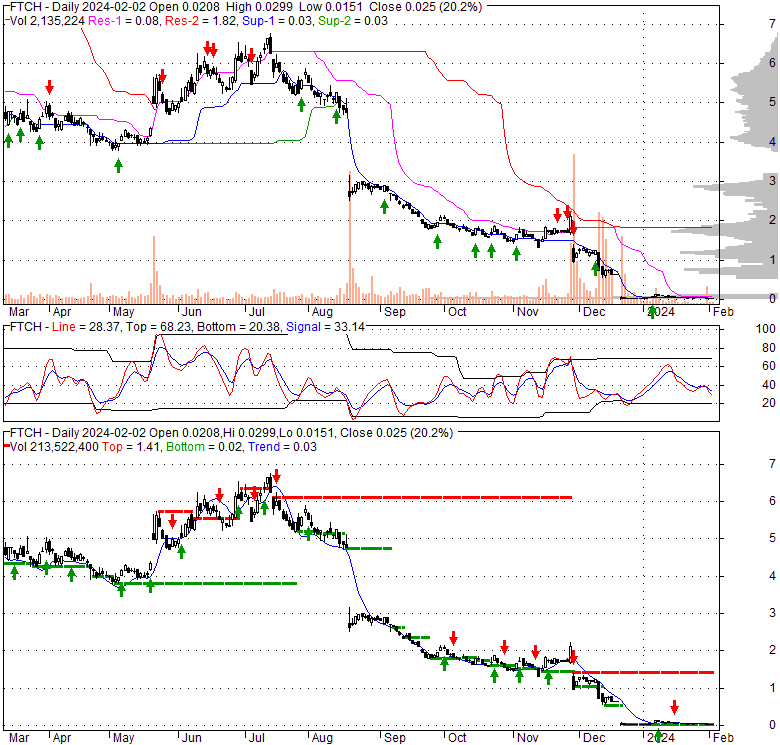
| Price, MAs and Bollinger Bands |
|---|
| Price has closed below its short-term moving average. Short-term moving average is currently below mid-term; and below long-term moving average. From the relationship between price and moving averages: This stock is BEARISH in short-term; and BEARISH in mid-long term.[ FTCH ] has closed above bottom band by 18.9%. Bollinger Bands are 92% narrower than normal. The narrow width of the bands suggests low volatility as compared to its normal range. The bands have been in this narrow range for 16 bars. This is a sign that the market may be about to initiate a new trend. |
| Company profile |
|---|
| Farfetch Limited, together with its subsidiaries, provides an online marketplace for luxury fashion goods in the United States, the United Kingdom, and internationally. It operates through three segments: Digital Platform, Brand Platform, and In-Store. The company operates Farfetch.com, an online marketplace, as well as Farfetch app for retailers and brands. It also offers web design, build, development, and retail distribution solutions for retailers and brands. As of December 31, 2021, operates two Browns retail stores; two Stadium Goods retail stores; and twelve New Guards Off-White stores, as well as three Ambush stores, two Palm Angels stores, and three Off-White outlets. In addition, it operates approximately sixty New Guards franchised retail stores and four seasonal stores under various brands. Farfetch Limited was founded in 2007 and is headquartered in London, the United Kingdom. |
| Stock chart |
|---|
 |
| Financial Analysis | |
|---|---|
| Price to Book Value: | Outperform |
| P/BV, a ratio used to compare book value to its current market price, to gauge whether a stock is valued properly. | |
| Price to Earnings: | Underperform |
| PE, the ratio for valuing a company that measures its current share price relative to its earnings per share (EPS). | |
| Discounted cash flow: | Outperform |
| DCF, a valuation method used to estimate the value of an investment based on its expected future cash flows. | |
| Return on Assets: | Underperform |
| ROA, indicates how profitable a company is in relation to its total assets, how efficiently uses assets to generate a profit. | |
| Return on Equity: | Underperform |
| ROE, a measure of financial performance calculated by dividing net income by equity. a gauge of profitability and efficiency. | |
| Debt to Equity: | Outperform |
| evaluate financial leverage, reflects the ability of equity to cover outstanding debts in the event of a business downturn. | |
| Stock Basics & Statistics | |
|---|---|
| Exchange: New York Stock Exchange | |
| Sector: Consumer Cyclical | |
| Industry: Specialty Retail | |
| Shares Out. (M) | 352.61 |
| Shares Float (M) | 357.04 |
| % Held by Insiders | 0.35 |
| % Held by Institutions | 63.91 |
| Shares Short (K) | 46260 |
| Shares Short Prior Month (K) | 47730 |
| Stock Financials | |
|---|---|
| EPS | -2.290 |
| Book Value (p.s.) | 1.150 |
| Profit Margin | -37.83 |
| Operating Margin | -33.54 |
| Return on Assets (ttm) | -13.3 |
| Return on Equity (ttm) | -105.3 |
| Qtrly Rev. Growth | -1.3 |
| Gross Profit (p.s.) | 2.893 |
| Sales Per Share | 6.665 |
| EBITDA (p.s.) | -1.598 |
| Qtrly Earnings Growth | |
| Operating Cash Flow (M) | -247.49 |
| Levered Free Cash Flow (M) | -306.42 |
| Stock Valuation | |
|---|---|
| PE Ratio | -0.01 |
| PEG Ratio | |
| Price to Book value | 0.02 |
| Price to Sales | |
| Price to Cash Flow | -0.04 |
| Stock Dividends | |
|---|---|
| Dividend | |
| Dividend Yield | |
| Dividend Growth | |


