| Technipfmc Plc (FTI) | |||
|---|---|---|---|
| 26.59 0.87 (3.38%) | 04-25 16:04 | ||
| Open: | 25.97 | Pre. Close: | 25.72 |
| High: | 27.01 | Low: | 25.9 |
| Volume: | 8,339,360 | Market Cap: | 11,623(M) |
| Stock Technical Analysis | |
|---|---|
| Overall: |  |
| Target: | Six months: 31.84 One year: 37.19 |
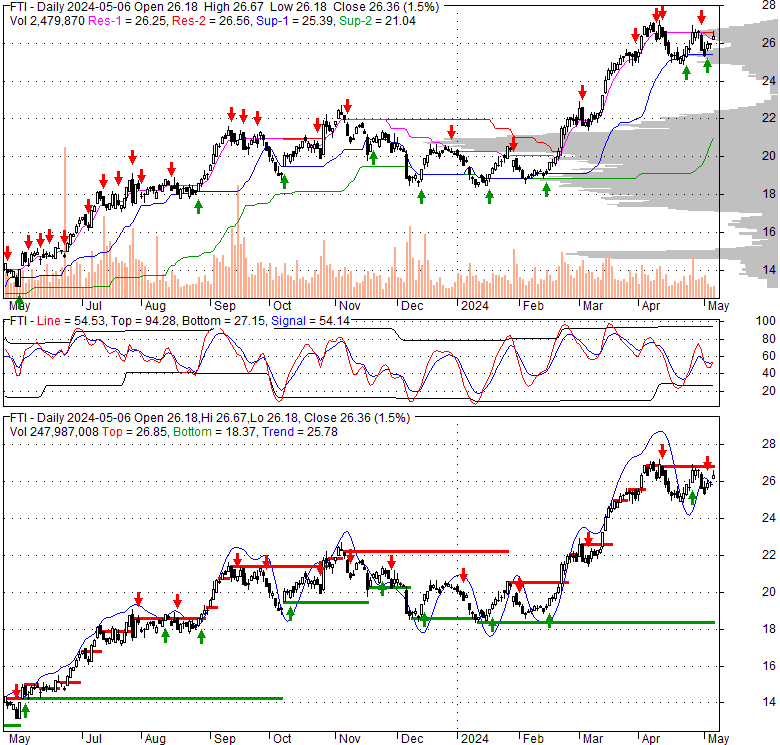
| Support: | Support1: 25.73 Support2: 24.79 |
| Resistance: | Resistance1: 27.26 Resistance2: 31.84 |
| Pivot: | 25.93 |
| Moving Averages: | MA(5): 25.75 MA(20): 25.96 MA(100): 21.75 MA(250): 19.56 |
| MACD: | MACD(12,26): 0.46 Signal(12,26,9): 0.59 |
| %K %D: | %K(14,3): 50.41 %D(3): 36.96 |
| RSI: | RSI(14): 64.10 |
| 52-Week: | High: 27.26 Low: 12.64 Change(%): 98.1 |
| Average Vol(K): | 3-Month: 4821 10-Days: 3974 |
| Prices Prediction (Update @5:00pm) | ||
|---|---|---|
| If tomorrow: | Open lower | Open higher |
| High: | 27.041 - 27.148 | 27.148 - 27.24 |
| Low: | 25.649 - 25.779 | 25.779 - 25.891 |
| Close: | 26.363 - 26.577 | 26.577 - 26.762 |
| Price, MAs and Bollinger Bands |
|---|
| Price has closed above its short-term moving average. Short-term moving average is currently above mid-term; and above long-term moving average. From the relationship between price and moving averages: This stock is BULLISH in short-term; and BULLISH in mid-long term.[ FTI ] has closed below upper band by 23.0%. Bollinger Bands are 15% narrower than normal. The current width of the bands does not suggest anything about the future direction or movement of prices. |
| Company profile |
|---|
| TechnipFMC plc engages in the oil and gas projects, technologies, and systems and services businesses in Europe, Central Asia, North and Latin America, the Asia Pacific, Africa, and the Middle East. The Subsea segment engages in the design, engineering, procurement, manufacturing, fabrication, installation, and life of field services for subsea systems, subsea field infrastructure, and subsea pipe systems used in oil and gas production and transportation. It provides subsea production and processing systems; subsea umbilicals, risers, and flowlines; vessels; and Subsea Studio for optimizing the development, execution, and operation of current and future subsea fields. This segment also offers well and asset services; research, engineering, manufacturing, and supply chain; and product management services. The Surface Technologies segment designs, manufactures, and services products and systems used in land and shallow water exploration and production of crude oil and natural gas. This segment offers drilling and completion systems; surface wellheads and production trees systems; iComplete, a digitally enabled pressure control system; fracturing tree and manifold systems; pressure pumping; well service pumps; well control, safety and integrity systems, multiphase meter modules, in-line separation and processing systems, and standard pumps; flowback and well testing services; skid systems; automation and digital systems; and flow measurement and automation solutions. It also offers planning, testing and installation, commissioning, operations, replacement and upgrade, maintenance, storage, preservation, intervention, integrity, decommissioning, and abandonment; and supplies flexible lines and flowline products and services. TechnipFMC plc has a strategic alliance with Talos Energy Inc. to develop and deliver technical and commercial solutions to Carbon Capture and Storage projects. The company was founded in 1884 and is based in Newcastle Upon Tyne, the United Kingdom. |
| Stock chart |
|---|
 |
| Financial Analysis | |
|---|---|
| Price to Book Value: | Outperform |
| P/BV, a ratio used to compare book value to its current market price, to gauge whether a stock is valued properly. | |
| Price to Earnings: | Outperform |
| PE, the ratio for valuing a company that measures its current share price relative to its earnings per share (EPS). | |
| Discounted cash flow: | Outperform |
| DCF, a valuation method used to estimate the value of an investment based on its expected future cash flows. | |
| Return on Assets: | Outperform |
| ROA, indicates how profitable a company is in relation to its total assets, how efficiently uses assets to generate a profit. | |
| Return on Equity: | Outperform |
| ROE, a measure of financial performance calculated by dividing net income by equity. a gauge of profitability and efficiency. | |
| Debt to Equity: | Outperform |
| evaluate financial leverage, reflects the ability of equity to cover outstanding debts in the event of a business downturn. | |
| Stock Basics & Statistics | |
|---|---|
| Exchange: New York Stock Exchange | |
| Sector: Energy | |
| Industry: Oil & Gas Equipment & Services | |
| Shares Out. (M) | 437.14 |
| Shares Float (M) | 434.11 |
| % Held by Insiders | 0.95 |
| % Held by Institutions | 99.57 |
| Shares Short (K) | 9200 |
| Shares Short Prior Month (K) | 10700 |
| Stock Financials | |
|---|---|
| EPS | 0.120 |
| Book Value (p.s.) | 7.420 |
| Profit Margin | 0.29 |
| Operating Margin | 10.45 |
| Return on Assets (ttm) | 3.8 |
| Return on Equity (ttm) | 0.6 |
| Qtrly Rev. Growth | 21.0 |
| Gross Profit (p.s.) | |
| Sales Per Share | 17.912 |
| EBITDA (p.s.) | 2.209 |
| Qtrly Earnings Growth | |
| Operating Cash Flow (M) | 742.90 |
| Levered Free Cash Flow (M) | 844.30 |
| Stock Valuation | |
|---|---|
| PE Ratio | 221.58 |
| PEG Ratio | -7.61 |
| Price to Book value | 3.58 |
| Price to Sales | 1.48 |
| Price to Cash Flow | 15.65 |
| Stock Dividends | |
|---|---|
| Dividend | |
| Dividend Yield | |
| Dividend Growth | |


