| Fortinet Inc (FTNT) | |||
|---|---|---|---|
| 58.88 -6.32 (-9.69%) | 05-03 16:00 | ||
| Open: | 61.86 | Pre. Close: | 65.2 |
| High: | 62.49 | Low: | 58.793 |
| Volume: | 15,871,063 | Market Cap: | 44,927(M) |
| Stock Technical Analysis | |
|---|---|
| Overall: |  |
| Target: | Six months: 79.38 One year: 86.00 |
| Support: | Support1: 58.79 Support2: 48.92 |
| Resistance: | Resistance1: 67.96 Resistance2: 73.63 |
| Pivot: | 63.90 |
| Moving Averages: | MA(5): 63.02 MA(20): 64.90 MA(100): 65.12 MA(250): 64.04 |
| MACD: | MACD(12,26): -1.44 Signal(12,26,9): -1.15 |
| %K %D: | %K(14,3): 22.15 %D(3): 21.19 |
| RSI: | RSI(14): 30.36 |
| 52-Week: | High: 81.24 Low: 44.12 Change(%): -8.8 |
| Average Vol(K): | 3-Month: 5041 10-Days: 5550 |
| Prices Prediction (Update @5:00pm) | ||
|---|---|---|
| If tomorrow: | Open lower | Open higher |
| High: | 62.563 - 62.893 | 62.893 - 63.173 |
| Low: | 58.037 - 58.397 | 58.397 - 58.704 |
| Close: | 58.293 - 58.9 | 58.9 - 59.416 |
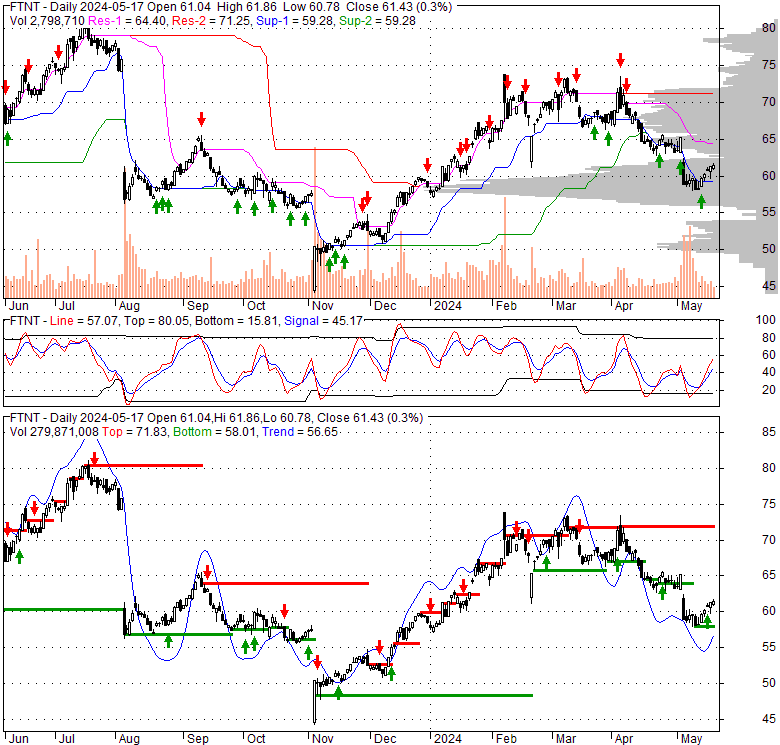
| Price, MAs and Bollinger Bands |
|---|
| Price has closed below its short-term moving average. Short-term moving average is currently below mid-term; and below long-term moving average. From the relationship between price and moving averages: This stock is BEARISH in short-term; and NEUTRAL in mid-long term.[ FTNT ] has closed below the lower bollinger band by 34.8%. If price is in a downtrend band; this downward trend might continue. However a short term pullback inside the band is likely. Bollinger Bands are 15.4% narrower than normal. The current width of the bands does not suggest anything about the future direction or movement of prices. |
| Company profile |
|---|
| Fortinet, Inc. provides broad, integrated, and automated cybersecurity solutions in the Americas, Europe, the Middle East, Africa, and the Asia Pacific. It offers FortiGate hardware and software licenses that provide various security and networking functions, including firewall, intrusion prevention, anti-malware, virtual private network, application control, web filtering, anti-spam, and wide area network acceleration. The company also provides FortiSwitch product family that offers secure switching solutions for connecting customers their end devices; FortiAP product family, which provides secure wireless networking solutions; FortiExtender, a hardware appliance; FortiAnalyzer product family, which offers centralized network logging, analyzing, and reporting solutions; and FortiManager product family that provides central and scalable management solution for its FortiGate products. It offers FortiWeb product family provides web application firewall solutions; FortiMail product family that secure email gateway solutions; FortiSandbox technology that delivers proactive detection and mitigation services; FortiClient that provides endpoint protection with pattern-based anti-malware, behavior-based exploit protection, web-filtering, and an application firewall; FortiToken and FortiAuthenticator product families for multi-factor authentication to safeguard systems, assets, and data; and FortiEDR/XDR, an endpoint protection solution that provides both comprehensive machine-learning anti-malware execution and real-time post-infection protection. It provides security subscription, technical support, professional, and training services. It sells its security solutions to channel partners and directly to various customers in telecommunications, technology, government, financial services, education, retail, manufacturing, and healthcare industries. It has strategic alliance with Linksys. Fortinet, Inc. was incorporated in 2000 and is headquartered in Sunnyvale, California. |
| Stock chart |
|---|
 |
| Financial Analysis | |
|---|---|
| Price to Book Value: | Underperform |
| P/BV, a ratio used to compare book value to its current market price, to gauge whether a stock is valued properly. | |
| Price to Earnings: | Outperform |
| PE, the ratio for valuing a company that measures its current share price relative to its earnings per share (EPS). | |
| Discounted cash flow: | Outperform |
| DCF, a valuation method used to estimate the value of an investment based on its expected future cash flows. | |
| Return on Assets: | Outperform |
| ROA, indicates how profitable a company is in relation to its total assets, how efficiently uses assets to generate a profit. | |
| Return on Equity: | Underperform |
| ROE, a measure of financial performance calculated by dividing net income by equity. a gauge of profitability and efficiency. | |
| Debt to Equity: | Underperform |
| evaluate financial leverage, reflects the ability of equity to cover outstanding debts in the event of a business downturn. | |
| Stock Basics & Statistics | |
|---|---|
| Exchange: NASDAQ Global Select | |
| Sector: Technology | |
| Industry: Software - Infrastructure | |
| Shares Out. (M) | 763.03 |
| Shares Float (M) | 640.99 |
| % Held by Insiders | 16.27 |
| % Held by Institutions | 70.03 |
| Shares Short (K) | 13190 |
| Shares Short Prior Month (K) | 12860 |
| Stock Financials | |
|---|---|
| EPS | 1.460 |
| Book Value (p.s.) | -0.610 |
| Profit Margin | 21.64 |
| Operating Margin | 27.15 |
| Return on Assets (ttm) | 11.5 |
| Return on Equity (ttm) | |
| Qtrly Rev. Growth | 10.3 |
| Gross Profit (p.s.) | |
| Sales Per Share | 6.946 |
| EBITDA (p.s.) | 1.769 |
| Qtrly Earnings Growth | 3.50 |
| Operating Cash Flow (M) | 1940.00 |
| Levered Free Cash Flow (M) | 1440.00 |
| Stock Valuation | |
|---|---|
| PE Ratio | 40.33 |
| PEG Ratio | 2.56 |
| Price to Book value | -96.52 |
| Price to Sales | 8.48 |
| Price to Cash Flow | 23.16 |
| Stock Dividends | |
|---|---|
| Dividend | |
| Dividend Yield | |
| Dividend Growth | |


