| Gilead Sciences Inc (GILD) | |||
|---|---|---|---|
| 65.42 0.15 (0.23%) | 04-26 16:00 | ||
| Open: | 65.5 | Pre. Close: | 65.27 |
| High: | 66.3507 | Low: | 64.64 |
| Volume: | 12,348,617 | Market Cap: | 81,577(M) |
| Stock Technical Analysis | |
|---|---|
| Overall: |  |
| Target: | Six months: 82.16 One year: 86.28 |
| Support: | Support1: 64.64 Support2: 53.78 |
| Resistance: | Resistance1: 70.34 Resistance2: 73.87 |
| Pivot: | 67.39 |
| Moving Averages: | MA(5): 66.35 MA(20): 68.29 MA(100): 75.75 MA(250): 76.64 |
| MACD: | MACD(12,26): -1.78 Signal(12,26,9): -1.68 |
| %K %D: | %K(14,3): 13.28 %D(3): 15.29 |
| RSI: | RSI(14): 26.11 |
| 52-Week: | High: 87.87 Low: 64.64 Change(%): -20.4 |
| Average Vol(K): | 3-Month: 7404 10-Days: 8045 |
| Prices Prediction (Update @5:00pm) | ||
|---|---|---|
| If tomorrow: | Open lower | Open higher |
| High: | 66.425 - 66.689 | 66.689 - 66.916 |
| Low: | 63.914 - 64.238 | 64.238 - 64.517 |
| Close: | 64.862 - 65.389 | 65.389 - 65.843 |
| Price, MAs and Bollinger Bands |
|---|
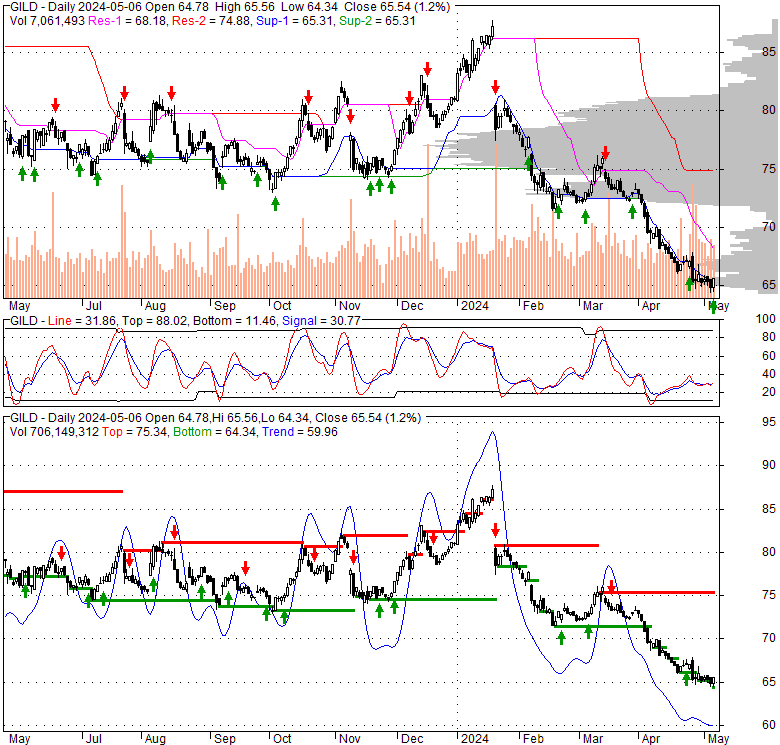
| Price has closed below its short-term moving average. Short-term moving average is currently below mid-term; and below long-term moving average. From the relationship between price and moving averages: This stock is BEARISH in short-term; and BEARISH in mid-long term.[ GILD ] has closed above bottom band by 11.3%. Bollinger Bands are 28.6% narrower than normal. The current width of the bands does not suggest anything about the future direction or movement of prices. |
| Company profile |
|---|
| Gilead Sciences, Inc., a biopharmaceutical company, discovers, develops, and commercializes medicines in the areas of unmet medical need in the United States, Europe, and internationally. The company provides Biktarvy, Genvoya, Descovy, Odefsey, Truvada, Complera/ Eviplera, Stribild, and Atripla products for the treatment of HIV/AIDS; Veklury, an injection for intravenous use, for the treatment of coronavirus disease 2019; and Epclusa, Harvoni, Vosevi, Vemlidy, and Viread for the treatment of liver diseases. It also offers Yescarta, Tecartus, Trodelvy, and Zydelig products for the treatment of hematology, oncology, and cell therapy patients. In addition, the company provides Letairis, an oral formulation for the treatment of pulmonary arterial hypertension; Ranexa, an oral formulation for the treatment of chronic angina; and AmBisome, a liposomal formulation for the treatment of serious invasive fungal infections. Gilead Sciences, Inc. has collaboration agreements with Arcus Biosciences, Inc.; Pionyr Immunotherapeutics Inc.; Tizona Therapeutics, Inc.; Tango Therapeutics, Inc.; Jounce Therapeutics, Inc.; Galapagos NV; Janssen Sciences Ireland Unlimited Company; Japan Tobacco, Inc.; Gadeta B.V.; Bristol-Myers Squibb Company; Dragonfly Therapeutics, Inc.; and Merck & Co, Inc. The company was incorporated in 1987 and is headquartered in Foster City, California. |
| Stock chart |
|---|
 |
| Financial Analysis | |
|---|---|
| Price to Book Value: | Underperform |
| P/BV, a ratio used to compare book value to its current market price, to gauge whether a stock is valued properly. | |
| Price to Earnings: | Underperform |
| PE, the ratio for valuing a company that measures its current share price relative to its earnings per share (EPS). | |
| Discounted cash flow: | Outperform |
| DCF, a valuation method used to estimate the value of an investment based on its expected future cash flows. | |
| Return on Assets: | Underperform |
| ROA, indicates how profitable a company is in relation to its total assets, how efficiently uses assets to generate a profit. | |
| Return on Equity: | Neutral |
| ROE, a measure of financial performance calculated by dividing net income by equity. a gauge of profitability and efficiency. | |
| Debt to Equity: | Underperform |
| evaluate financial leverage, reflects the ability of equity to cover outstanding debts in the event of a business downturn. | |
| Stock Basics & Statistics | |
|---|---|
| Exchange: NASDAQ Global Select | |
| Sector: Healthcare | |
| Industry: Drug Manufacturers - General | |
| Shares Out. (M) | 1250.00 |
| Shares Float (M) | 1240.00 |
| % Held by Insiders | 0.09 |
| % Held by Institutions | 88.32 |
| Shares Short (K) | 22570 |
| Shares Short Prior Month (K) | 19670 |
| Stock Financials | |
|---|---|
| EPS | 4.500 |
| Book Value (p.s.) | 18.330 |
| Profit Margin | 20.89 |
| Operating Margin | 42.21 |
| Return on Assets (ttm) | 9.8 |
| Return on Equity (ttm) | 25.5 |
| Qtrly Rev. Growth | -3.7 |
| Gross Profit (p.s.) | |
| Sales Per Share | 21.696 |
| EBITDA (p.s.) | 9.992 |
| Qtrly Earnings Growth | -13.10 |
| Operating Cash Flow (M) | 8010.00 |
| Levered Free Cash Flow (M) | 8790.00 |
| Stock Valuation | |
|---|---|
| PE Ratio | 14.54 |
| PEG Ratio | 2.46 |
| Price to Book value | 3.57 |
| Price to Sales | 3.02 |
| Price to Cash Flow | 10.21 |
| Stock Dividends | |
|---|---|
| Dividend | 0.770 |
| Dividend Yield | 0.01 |
| Dividend Growth | |