| Corning Inc (GLW) | |||
|---|---|---|---|
| 30.91 -0.07 (-0.23%) | 04-18 16:00 | ||
| Open: | 31.05 | Pre. Close: | 30.98 |
| High: | 31.13 | Low: | 30.7211 |
| Volume: | 4,653,680 | Market Cap: | 26,439(M) |
| Stock Technical Analysis | |
|---|---|
| Overall: |  |
| Target: | Six months: 37.77 One year: 38.94 |
| Support: | Support1: 30.72 Support2: 25.56 |
| Resistance: | Resistance1: 32.34 Resistance2: 33.34 |
| Pivot: | 32.01 |
| Moving Averages: | MA(5): 31.12 MA(20): 32.18 MA(100): 31.25 MA(250): 31.36 |
| MACD: | MACD(12,26): -0.36 Signal(12,26,9): -0.16 |
| %K %D: | %K(14,3): 3.81 %D(3): 2.83 |
| RSI: | RSI(14): 34.83 |
| 52-Week: | High: 36.02 Low: 25.26 Change(%): -9.0 |
| Average Vol(K): | 3-Month: 4749 10-Days: 4579 |
| Prices Prediction (Update @5:00pm) | ||
|---|---|---|
| If tomorrow: | Open lower | Open higher |
| High: | 31.218 - 31.391 | 31.391 - 31.532 |
| Low: | 30.178 - 30.426 | 30.426 - 30.628 |
| Close: | 30.545 - 30.913 | 30.913 - 31.212 |
| Price, MAs and Bollinger Bands |
|---|
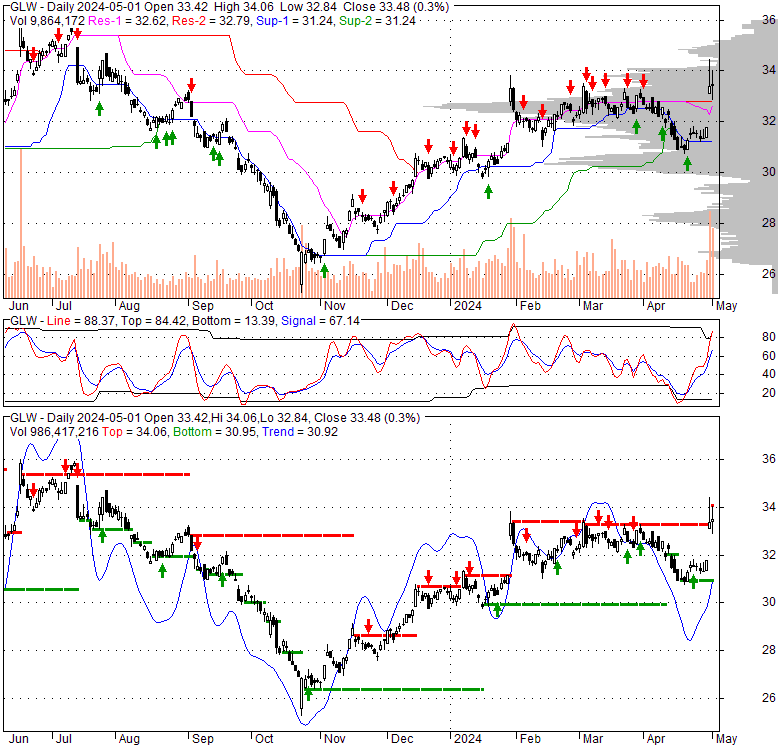
| Price has closed below its short-term moving average. Short-term moving average is currently below mid-term; and below long-term moving average. From the relationship between price and moving averages: This stock is BEARISH in short-term; and NEUTRAL in mid-long term.[ GLW ] has closed above bottom band by 9.6%. Bollinger Bands are 51.7% wider than normal. The large width of the bands suggest high volatility as compared to its normal range. The bands have been in this wide range for 1 days. This is a sign that the current trend might continue. |
| Company profile |
|---|
| Corning Incorporated engages in display technologies, optical communications, environmental technologies, specialty materials, and life sciences businesses worldwide. The company's Display Technologies segment offers glass substrates for liquid crystal displays and organic light-emitting diodes used in televisions, notebook computers, desktop monitors, tablets, and handheld devices. Its Optical Communications segment provides optical fibers and cables; and hardware and equipment products, including cable assemblies, fiber optic hardware and connectors, optical components and couplers, closures, network interface devices, and other accessories. This segment also offers its products to businesses, governments, and individuals. Its Specialty Materials segment manufactures products that provide material formulations for glass, glass ceramics, crystals, precision metrology instruments, software; as well as ultra-thin and ultra-flat glass wafers, substrates, tinted sunglasses, and radiation shielding products. This segment serves various industries, including mobile consumer electronics, semiconductor equipment optics and consumables; aerospace and defense optics; radiation shielding products, sunglasses, and telecommunications components. The company's Environmental Technologies segment offers ceramic substrates and filter products for emissions control in mobile, gasoline, and diesel applications. The company's Life Sciences segment offers laboratory products comprising consumables, such as plastic vessels, liquid handling plastics, specialty surfaces, cell culture media, and serum, as well as general labware and equipment under the Corning, Falcon, Pyrex, and Axygen brands. The company was formerly known as Corning Glass Works and changed its name to Corning Incorporated in April 1989. Corning Incorporated was founded in 1851 and is headquartered in Corning, New York. |
| Stock chart |
|---|
 |
| Financial Analysis | |
|---|---|
| Price to Book Value: | Neutral |
| P/BV, a ratio used to compare book value to its current market price, to gauge whether a stock is valued properly. | |
| Price to Earnings: | Underperform |
| PE, the ratio for valuing a company that measures its current share price relative to its earnings per share (EPS). | |
| Discounted cash flow: | Neutral |
| DCF, a valuation method used to estimate the value of an investment based on its expected future cash flows. | |
| Return on Assets: | Underperform |
| ROA, indicates how profitable a company is in relation to its total assets, how efficiently uses assets to generate a profit. | |
| Return on Equity: | Underperform |
| ROE, a measure of financial performance calculated by dividing net income by equity. a gauge of profitability and efficiency. | |
| Debt to Equity: | Outperform |
| evaluate financial leverage, reflects the ability of equity to cover outstanding debts in the event of a business downturn. | |
| Stock Basics & Statistics | |
|---|---|
| Exchange: New York Stock Exchange | |
| Sector: Technology | |
| Industry: Hardware, Equipment & Parts | |
| Shares Out. (M) | 855.35 |
| Shares Float (M) | 770.00 |
| % Held by Insiders | 9.66 |
| % Held by Institutions | 70.97 |
| Shares Short (K) | 11520 |
| Shares Short Prior Month (K) | 10320 |
| Stock Financials | |
|---|---|
| EPS | 0.680 |
| Book Value (p.s.) | 14.090 |
| Profit Margin | 4.62 |
| Operating Margin | 16.43 |
| Return on Assets (ttm) | 2.8 |
| Return on Equity (ttm) | 5.4 |
| Qtrly Rev. Growth | -12.1 |
| Gross Profit (p.s.) | |
| Sales Per Share | 14.719 |
| EBITDA (p.s.) | 3.145 |
| Qtrly Earnings Growth | |
| Operating Cash Flow (M) | 2000.00 |
| Levered Free Cash Flow (M) | 214.88 |
| Stock Valuation | |
|---|---|
| PE Ratio | 45.46 |
| PEG Ratio | 2.42 |
| Price to Book value | 2.19 |
| Price to Sales | 2.10 |
| Price to Cash Flow | 13.22 |
| Stock Dividends | |
|---|---|
| Dividend | |
| Dividend Yield | |
| Dividend Growth | |