| Himax Technologies ADR (HIMX) | |||
|---|---|---|---|
| 5.04 0.08 (1.61%) | 04-26 16:00 | ||
| Open: | 4.96 | Pre. Close: | 4.96 |
| High: | 5.07 | Low: | 4.94 |
| Volume: | 420,064 | Market Cap: | 899(M) |
| Stock Technical Analysis | |
|---|---|
| Overall: |  |
| Target: | Six months: 6.18 One year: 6.53 |
| Support: | Support1: 4.80 Support2: 3.99 |
| Resistance: | Resistance1: 5.29 Resistance2: 5.59 |
| Pivot: | 5.12 |
| Moving Averages: | MA(5): 4.95 MA(20): 5.18 MA(100): 5.64 MA(250): 6.07 |
| MACD: | MACD(12,26): -0.15 Signal(12,26,9): -0.14 |
| %K %D: | %K(14,3): 25.02 %D(3): 19.49 |
| RSI: | RSI(14): 41.71 |
| 52-Week: | High: 7.7 Low: 4.8 Change(%): -24.1 |
| Average Vol(K): | 3-Month: 741 10-Days: 547 |
| Prices Prediction (Update @5:00pm) | ||
|---|---|---|
| If tomorrow: | Open lower | Open higher |
| High: | 5.076 - 5.096 | 5.096 - 5.113 |
| Low: | 4.885 - 4.909 | 4.909 - 4.931 |
| Close: | 4.997 - 5.038 | 5.038 - 5.073 |
| Price, MAs and Bollinger Bands |
|---|
| Price has closed above its short-term moving average. Short-term moving average is currently below mid-term; and below long-term moving average. From the relationship between price and moving averages: This stock is NEUTRAL in short-term; and BEARISH in mid-long term.[ HIMX ] has closed above bottom band by 41.1%. Bollinger Bands are 25.3% wider than normal. The current width of the bands does not suggest anything about the future direction or movement of prices. |
| Company profile |
|---|
| Himax Technologies, Inc., a fabless semiconductor company, provides display imaging processing technologies in China, Taiwan, the Philippines, Korea, Japan, Europe, and the United States. The company operates through two segments, Driver IC and Non-Driver Products. It offers display driver integrated circuits (ICs) and timing controllers that are used in televisions, laptops, monitors, mobile phones, tablets, automotive, digital cameras, car navigation, virtual reality devices, and other consumer electronic devices. The company also designs and provides controllers for touch sensor displays; in-cell touch and display driver integration single-chip solutions; light-emitting diode driver and power management ICs; and liquid crystal on silicon microdisplays for augmented reality (AR) devices and head-up displays for the automotive industry. In addition, it offers complementary metal-oxide-semiconductor image sensors and wafer-level optics for AR devices, 3D sensing, and ultra-low power AI image sensing, which are used in various applications, such as mobile phones, tablets, laptops, TV, PC camera, automobile, security, medical devices, home appliance, Internet of Things, etc. The company markets its display drivers and display-related products to panel manufacturers, agents or distributors, module manufacturers, and assembly houses; and non-driver products to camera module manufacturers, optical engine manufacturers, and television system manufacturers. Himax Technologies, Inc. was incorporated in 2001 and is headquartered in Tainan City, Taiwan. |
| Stock chart |
|---|
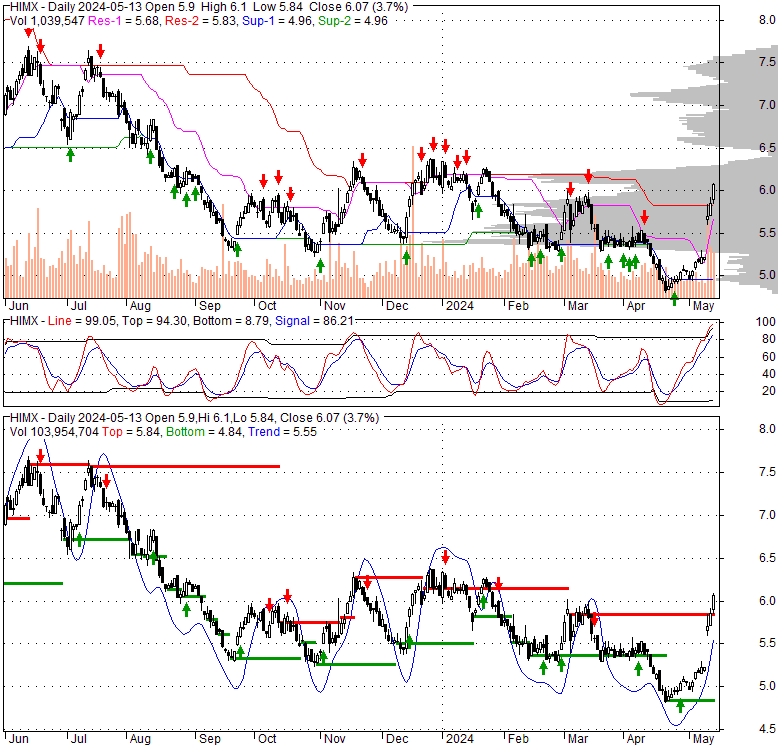 |
| Financial Analysis | |
|---|---|
| Price to Book Value: | Underperform |
| P/BV, a ratio used to compare book value to its current market price, to gauge whether a stock is valued properly. | |
| Price to Earnings: | Neutral |
| PE, the ratio for valuing a company that measures its current share price relative to its earnings per share (EPS). | |
| Discounted cash flow: | Outperform |
| DCF, a valuation method used to estimate the value of an investment based on its expected future cash flows. | |
| Return on Assets: | Outperform |
| ROA, indicates how profitable a company is in relation to its total assets, how efficiently uses assets to generate a profit. | |
| Return on Equity: | Outperform |
| ROE, a measure of financial performance calculated by dividing net income by equity. a gauge of profitability and efficiency. | |
| Debt to Equity: | Outperform |
| evaluate financial leverage, reflects the ability of equity to cover outstanding debts in the event of a business downturn. | |
| Stock Basics & Statistics | |
|---|---|
| Exchange: NASDAQ Global Select | |
| Sector: Technology | |
| Industry: Semiconductors | |
| Shares Out. (M) | 174.72 |
| Shares Float (M) | 247.79 |
| % Held by Insiders | 30.95 |
| % Held by Institutions | 14.37 |
| Shares Short (K) | 6260 |
| Shares Short Prior Month (K) | 6160 |
| Stock Financials | |
|---|---|
| EPS | 0.280 |
| Book Value (p.s.) | 4.910 |
| Profit Margin | 5.35 |
| Operating Margin | 7.33 |
| Return on Assets (ttm) | 1.6 |
| Return on Equity (ttm) | 5.6 |
| Qtrly Rev. Growth | -13.2 |
| Gross Profit (p.s.) | |
| Sales Per Share | 5.411 |
| EBITDA (p.s.) | 0.336 |
| Qtrly Earnings Growth | -48.60 |
| Operating Cash Flow (M) | 152.84 |
| Levered Free Cash Flow (M) | 75.56 |
| Stock Valuation | |
|---|---|
| PE Ratio | 18.00 |
| PEG Ratio | -1.20 |
| Price to Book value | 1.03 |
| Price to Sales | 0.93 |
| Price to Cash Flow | 5.76 |
| Stock Dividends | |
|---|---|
| Dividend | 0.480 |
| Dividend Yield | 0.10 |
| Dividend Growth | |


