| Harmony Gold Mining ADR (HMY) | |||
|---|---|---|---|
| 9.03 0.29 (3.32%) | 04-25 16:00 | ||
| Open: | 8.7 | Pre. Close: | 8.74 |
| High: | 9.18 | Low: | 8.67 |
| Volume: | 6,006,700 | Market Cap: | 5,712(M) |
| Stock Technical Analysis | |
|---|---|
| Overall: |  |
| Target: | Six months: 11.45 One year: 13.37 |
| Support: | Support1: 8.48 Support2: 7.67 |
| Resistance: | Resistance1: 9.80 Resistance2: 11.45 |
| Pivot: | 8.98 |
| Moving Averages: | MA(5): 8.91 MA(20): 8.82 MA(100): 6.80 MA(250): 5.42 |
| MACD: | MACD(12,26): 0.35 Signal(12,26,9): 0.44 |
| %K %D: | %K(14,3): 33.80 %D(3): 34.29 |
| RSI: | RSI(14): 61.50 |
| 52-Week: | High: 9.8 Low: 3.41 Change(%): 97.6 |
| Average Vol(K): | 3-Month: 6556 10-Days: 6908 |
| Prices Prediction (Update @5:00pm) | ||
|---|---|---|
| If tomorrow: | Open lower | Open higher |
| High: | 9.189 - 9.233 | 9.233 - 9.272 |
| Low: | 8.567 - 8.617 | 8.617 - 8.66 |
| Close: | 8.954 - 9.033 | 9.033 - 9.101 |
| Price, MAs and Bollinger Bands |
|---|
| Price has closed above its short-term moving average. Short-term moving average is currently above mid-term; and above long-term moving average. From the relationship between price and moving averages: This stock is BULLISH in short-term; and BULLISH in mid-long term.[ HMY ] has closed below upper band by 42.1%. Bollinger Bands are 48.2% narrower than normal. The narrow width of the bands suggests low volatility as compared to its normal range. The bands have been in this narrow range for 1 bars. This is a sign that the market may be about to initiate a new trend. |
| Company profile |
|---|
| Harmony Gold Mining Company Limited engages in the exploration, extraction, and processing of gold. It also explores for uranium, silver, copper, and molybdenum deposits. The company has nine underground operations in the Witwatersrand Basin; an open-pit mine on the Kraaipan Greenstone Belt; and various surface treatment operations in South Africa. It also owns interests in the Hidden Valley, an open-pit gold and silver mine; and Wafi-Golpu, a project in Morobe Province in Papua New Guinea. The company was incorporated in 1950 and is headquartered in Randfontein, South Africa. |
| Stock chart |
|---|
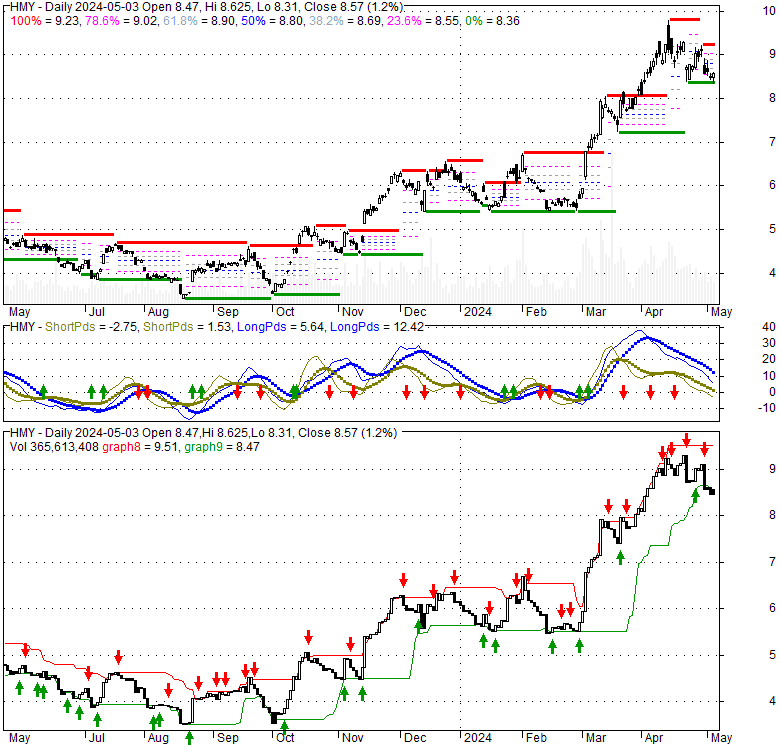 |
| Financial Analysis | |
|---|---|
| Price to Book Value: | Outperform |
| P/BV, a ratio used to compare book value to its current market price, to gauge whether a stock is valued properly. | |
| Price to Earnings: | Outperform |
| PE, the ratio for valuing a company that measures its current share price relative to its earnings per share (EPS). | |
| Discounted cash flow: | Outperform |
| DCF, a valuation method used to estimate the value of an investment based on its expected future cash flows. | |
| Return on Assets: | Outperform |
| ROA, indicates how profitable a company is in relation to its total assets, how efficiently uses assets to generate a profit. | |
| Return on Equity: | Outperform |
| ROE, a measure of financial performance calculated by dividing net income by equity. a gauge of profitability and efficiency. | |
| Debt to Equity: | Outperform |
| evaluate financial leverage, reflects the ability of equity to cover outstanding debts in the event of a business downturn. | |
| Stock Basics & Statistics | |
|---|---|
| Exchange: New York Stock Exchange | |
| Sector: Basic Materials | |
| Industry: Gold | |
| Shares Out. (M) | 619.93 |
| Shares Float (M) | 416.25 |
| % Held by Insiders | |
| % Held by Institutions | 32.83 |
| Shares Short (K) | 10570 |
| Shares Short Prior Month (K) | 7170 |
| Stock Financials | |
|---|---|
| EPS | 0.750 |
| Book Value (p.s.) | 64.250 |
| Profit Margin | 15.50 |
| Operating Margin | 23.75 |
| Return on Assets (ttm) | 13.5 |
| Return on Equity (ttm) | 25.0 |
| Qtrly Rev. Growth | 35.1 |
| Gross Profit (p.s.) | |
| Sales Per Share | 92.639 |
| EBITDA (p.s.) | 25.890 |
| Qtrly Earnings Growth | 220.90 |
| Operating Cash Flow (M) | 13880.00 |
| Levered Free Cash Flow (M) | 3660.00 |
| Stock Valuation | |
|---|---|
| PE Ratio | 12.04 |
| PEG Ratio | |
| Price to Book value | 0.14 |
| Price to Sales | 0.10 |
| Price to Cash Flow | 0.40 |
| Stock Dividends | |
|---|---|
| Dividend | |
| Dividend Yield | |
| Dividend Growth | |


