| Healthequity (HQY) | |||
|---|---|---|---|
| 79.83 -0.47 (-0.59%) | 04-30 12:22 | ||
| Open: | 80.5 | Pre. Close: | 80.3 |
| High: | 80.5 | Low: | 79.135 |
| Volume: | 110,949 | Market Cap: | 6,878(M) |
| Stock Technical Analysis | |
|---|---|
| Overall: |  |
| Target: | Six months: 94.85 One year: 97.31 |
| Support: | Support1: 77.81 Support2: 64.74 |
| Resistance: | Resistance1: 81.21 Resistance2: 83.32 |
| Pivot: | 80.18 |
| Moving Averages: | MA(5): 79.77 MA(20): 79.92 MA(100): 76.55 MA(250): 70.26 |
| MACD: | MACD(12,26): -0.14 Signal(12,26,9): -0.14 |
| %K %D: | %K(14,3): 57.59 %D(3): 49.17 |
| RSI: | RSI(14): 49.33 |
| 52-Week: | High: 84.49 Low: 48.86 Change(%): 55.2 |
| Average Vol(K): | 3-Month: 536 10-Days: 441 |
| Prices Prediction (Update @5:00pm) | ||
|---|---|---|
| If tomorrow: | Open lower | Open higher |
| High: | 80.907 - 81.294 | 81.294 - 81.645 |
| Low: | 78.71 - 79.168 | 79.168 - 79.584 |
| Close: | 79.553 - 80.298 | 80.298 - 80.975 |
| Price, MAs and Bollinger Bands |
|---|
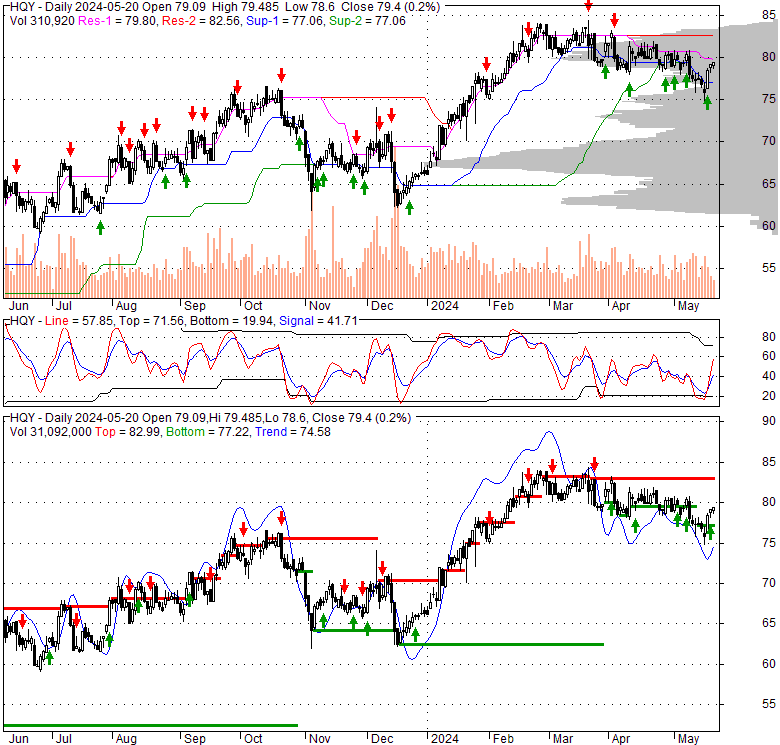
| Price has closed above its short-term moving average. Short-term moving average is currently below mid-term; and above long-term moving average. From the relationship between price and moving averages: This stock is NEUTRAL in short-term; and NEUTRAL in mid-long term.[ HQY ] has closed above bottom band by 45.6%. Bollinger Bands are 62.3% narrower than normal. The narrow width of the bands suggests low volatility as compared to its normal range. The bands have been in this narrow range for 5 bars. This is a sign that the market may be about to initiate a new trend. |
| Company profile |
|---|
| HealthEquity, Inc. provides technology-enabled services platforms to consumers and employers in the United States. The company offers cloud-based platforms for individuals to make health saving and spending decisions, pay healthcare bills, compare treatment options and prices, receive personalized benefit and clinical information, earn wellness incentives, grow their savings, and make investment choices; and health savings accounts. It also provides mutual fund investment platform; and online-only automated investment advisory services through Advisor, a Web-based tool. In addition, the company offers flexible spending accounts; health reimbursement arrangements; and Consolidated Omnibus Budget Reconciliation Act continuation services, as well as administers pre-tax commuter benefit programs. It serves clients through a direct sales force; benefits brokers and advisors; and a network of health plans, benefits administrators, benefits brokers and consultants, and retirement plan record-keepers. The company was incorporated in 2002 and is headquartered in Draper, Utah. |
| Stock chart |
|---|
 |
| Financial Analysis | |
|---|---|
| Price to Book Value: | Outperform |
| P/BV, a ratio used to compare book value to its current market price, to gauge whether a stock is valued properly. | |
| Price to Earnings: | Outperform |
| PE, the ratio for valuing a company that measures its current share price relative to its earnings per share (EPS). | |
| Discounted cash flow: | Outperform |
| DCF, a valuation method used to estimate the value of an investment based on its expected future cash flows. | |
| Return on Assets: | Outperform |
| ROA, indicates how profitable a company is in relation to its total assets, how efficiently uses assets to generate a profit. | |
| Return on Equity: | Neutral |
| ROE, a measure of financial performance calculated by dividing net income by equity. a gauge of profitability and efficiency. | |
| Debt to Equity: | Outperform |
| evaluate financial leverage, reflects the ability of equity to cover outstanding debts in the event of a business downturn. | |
| Stock Basics & Statistics | |
|---|---|
| Exchange: NASDAQ Global Select | |
| Sector: Healthcare | |
| Industry: Medical - Healthcare Information Services | |
| Shares Out. (M) | 86.16 |
| Shares Float (M) | 84.49 |
| % Held by Insiders | 2.22 |
| % Held by Institutions | 102.21 |
| Shares Short (K) | 2980 |
| Shares Short Prior Month (K) | 2970 |
| Stock Financials | |
|---|---|
| EPS | 0.640 |
| Book Value (p.s.) | 23.630 |
| Profit Margin | 5.57 |
| Operating Margin | 15.69 |
| Return on Assets (ttm) | 2.6 |
| Return on Equity (ttm) | 2.8 |
| Qtrly Rev. Growth | 12.2 |
| Gross Profit (p.s.) | |
| Sales Per Share | 11.602 |
| EBITDA (p.s.) | 3.264 |
| Qtrly Earnings Growth | |
| Operating Cash Flow (M) | 242.83 |
| Levered Free Cash Flow (M) | 211.89 |
| Stock Valuation | |
|---|---|
| PE Ratio | 125.11 |
| PEG Ratio | 1.13 |
| Price to Book value | 3.39 |
| Price to Sales | 6.90 |
| Price to Cash Flow | 28.41 |
| Stock Dividends | |
|---|---|
| Dividend | |
| Dividend Yield | |
| Dividend Growth | |