| IHS Markit Ltd (INFO) | |||
|---|---|---|---|
| 108.61 0.8 (0.74%) | 11-23 00:00 | ||
| Open: | 106.99 | Pre. Close: | 107.81 |
| High: | 109.16 | Low: | 105.24 |
| Volume: | 29,945,829 | Market Cap: | 413(M) |
| Stock Technical Analysis | |
|---|---|
| Overall: |  |
| Target: | Six months: 127.50 One year: 148.92 |
| Support: | Support1: 106.74 Support2: 105.24 |
| Resistance: | Resistance1: 109.16 Resistance2: 127.50 |
| Pivot: | 108.61 |
| Moving Averages: | MA(5): 108.61 MA(20): 108.61 MA(100): 108.61 MA(250): 113.28 |
| MACD: | MACD(12,26): Signal(12,26,9): |
| %K %D: | %K(14,3): 85.97 %D(3): 85.97 |
| RSI: | RSI(14): 38.90 |
| 52-Week: | High: 135.82 Low: 90.99 Change(%): -14.4 |
| Average Vol(K): | 3-Month: 29946 10-Days: 29946 |
| Prices Prediction (Update @5:00pm) | ||
|---|---|---|
| If tomorrow: | Open lower | Open higher |
| High: | 109.414 - 109.953 | 109.953 - 110.39 |
| Low: | 103.767 - 104.491 | 104.491 - 105.079 |
| Close: | 107.575 - 108.694 | 108.694 - 109.602 |
| Price, MAs and Bollinger Bands |
|---|
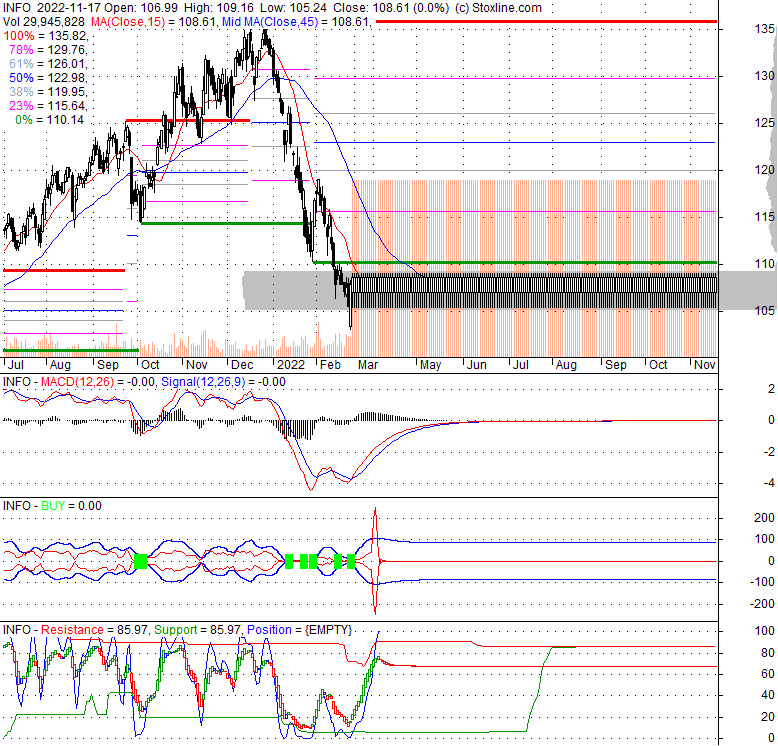
| Price has closed below its short-term moving average. Short-term moving average is currently below mid-term; and below long-term moving average. From the relationship between price and moving averages: This stock is NEUTRAL in short-term; and NEUTRAL in mid-long term.[ INFO ] has closed Bollinger Bands are 0% narrower than normal. |
| Company profile |
|---|
| IHS Markit Ltd. provides critical information, analytics, and solutions for various industries and markets worldwide. It operates through four segments: Financial Services, Transportation, Resources, and Consolidated Markets & Solutions. The Financial Services segment offers pricing and reference data, indices, valuation and trading services, trade processing, enterprise software, and managed services to traders, portfolio managers, risk managers, research professionals, and other financial market participants, as well as operations, compliance, and enterprise data managers. The Transportation segment provides authoritative analysis; sales and production forecasts for light vehicles, medium and heavy commercial vehicles, powertrains, components, and technology systems; performance measurement and marketing tools for carmakers, dealers, and agencies; predictive analytics and marketing automation software; and critical information for used car dealers and their customers in the used car buying process, as well as comprehensive data on ships, and monthly import and export statistics. The Resources segment offers upstream services include technical information, analytical tools, and market forecasting and consulting for the upstream industry; and downstream information, such as market forecasting, midstream market analysis and supply chain data, refining and marketing economics, and oil product pricing information for the chemical, refined products, agriculture, and power industries. The Consolidated Markets & Solutions segment provides discovery technologies, research tools, and software-based engineering decision engines; and economic and risk data and analytics, forecasts, and scenario tools. IHS Markit Ltd. was founded in 1959 and is headquartered in London, the United Kingdom. As of February 28, 2022, IHS Markit Ltd. operates as a subsidiary of S&P Global Inc. |
| Stock chart |
|---|
 |
| Financial Analysis | |
|---|---|
| Price to Book Value: | Outperform |
| P/BV, a ratio used to compare book value to its current market price, to gauge whether a stock is valued properly. | |
| Price to Earnings: | Outperform |
| PE, the ratio for valuing a company that measures its current share price relative to its earnings per share (EPS). | |
| Discounted cash flow: | Outperform |
| DCF, a valuation method used to estimate the value of an investment based on its expected future cash flows. | |
| Return on Assets: | Neutral |
| ROA, indicates how profitable a company is in relation to its total assets, how efficiently uses assets to generate a profit. | |
| Return on Equity: | Neutral |
| ROE, a measure of financial performance calculated by dividing net income by equity. a gauge of profitability and efficiency. | |
| Debt to Equity: | Outperform |
| evaluate financial leverage, reflects the ability of equity to cover outstanding debts in the event of a business downturn. | |
| Stock Basics & Statistics | |
|---|---|
| Exchange: New York Stock Exchange | |
| Sector: Industrials | |
| Industry: Consulting Services | |
| Shares Out. (M) | 398.84 |
| Shares Float (M) | 396.43 |
| % Held by Insiders | 7.10 |
| % Held by Institutions | 90.97 |
| Shares Short (K) | 21450 |
| Shares Short Prior Month (K) | 17200 |
| Stock Financials | |
|---|---|
| EPS | 1.550 |
| Book Value (p.s.) | 22.330 |
| Profit Margin | 25.91 |
| Operating Margin | 26.62 |
| Return on Assets (ttm) | 4.7 |
| Return on Equity (ttm) | 13.4 |
| Qtrly Rev. Growth | 6.2 |
| Gross Profit (p.s.) | 7.396 |
| Sales Per Share | 11.684 |
| EBITDA (p.s.) | 4.588 |
| Qtrly Earnings Growth | 383.60 |
| Operating Cash Flow (M) | 1490.00 |
| Levered Free Cash Flow (M) | 984.55 |
| Stock Valuation | |
|---|---|
| PE Ratio | 70.07 |
| PEG Ratio | 3.73 |
| Price to Book value | 4.86 |
| Price to Sales | 9.30 |
| Price to Cash Flow | 29.07 |
| Stock Dividends | |
|---|---|
| Dividend | |
| Dividend Yield | |
| Dividend Growth | |


