| Intel Corp (INTC) | |||
|---|---|---|---|
| 31.65 -3.46 (-9.85%) | 04-26 11:06 | ||
| Open: | 31.78 | Pre. Close: | 35.11 |
| High: | 31.95 | Low: | 30.64 |
| Volume: | 52,850,401 | Market Cap: | 133,816(M) |
| Stock Technical Analysis | |
|---|---|
| Overall: |  |
| Target: | Six months: 46.45 One year: 53.04 |
| Support: | Support1: 30.64 Support2: 25.49 |
| Resistance: | Resistance1: 39.77 Resistance2: 45.41 |
| Pivot: | 35.58 |
| Moving Averages: | MA(5): 33.88 MA(20): 37.05 MA(100): 43.29 MA(250): 38.25 |
| MACD: | MACD(12,26): -2.34 Signal(12,26,9): -2.07 |
| %K %D: | %K(14,3): 10.47 %D(3): 8.01 |
| RSI: | RSI(14): 22.76 |
| 52-Week: | High: 51.28 Low: 26.86 Change(%): 0.2 |
| Average Vol(K): | 3-Month: 46819 10-Days: 46286 |
| Prices Prediction (Update @5:00pm) | ||
|---|---|---|
| If tomorrow: | Open lower | Open higher |
| High: | 35.336 - 35.479 | 35.479 - 35.615 |
| Low: | 34.145 - 34.303 | 34.303 - 34.454 |
| Close: | 34.856 - 35.105 | 35.105 - 35.342 |
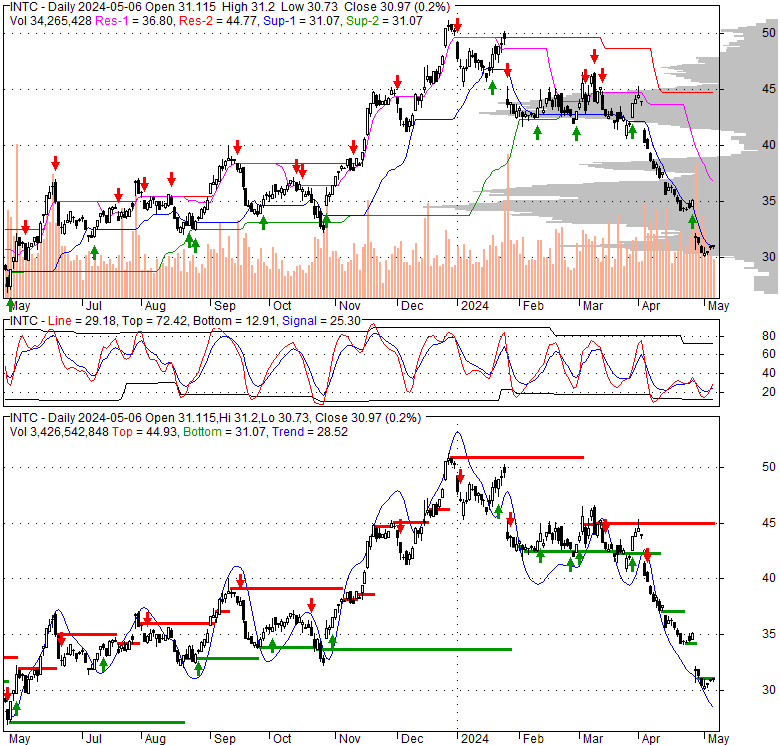
| Price, MAs and Bollinger Bands |
|---|
| Price has closed below its short-term moving average. Short-term moving average is currently below mid-term; and below long-term moving average. From the relationship between price and moving averages: This stock is BEARISH in short-term; and BEARISH in mid-long term.[ INTC ] has closed below the lower bollinger band by 12.6%. If price is in a downtrend band; this downward trend might continue. However a short term pullback inside the band is likely. Bollinger Bands are 12.7% wider than normal. The current width of the bands does not suggest anything about the future direction or movement of prices. |
| Company profile |
|---|
| Intel Corporation engages in the design, manufacture, and sale of computer products and technologies worldwide. The company operates through CCG, DCG, IOTG, Mobileye, NSG, PSG, and All Other segments. It offers platform products, such as central processing units and chipsets, and system-on-chip and multichip packages; and non-platform or adjacent products, including accelerators, boards and systems, connectivity products, graphics, and memory and storage products. The company also provides high-performance compute solutions for targeted verticals and embedded applications for retail, industrial, and healthcare markets; and solutions for assisted and autonomous driving comprising compute platforms, computer vision and machine learning-based sensing, mapping and localization, driving policy, and active sensors. In addition, it offers workload-optimized platforms and related products for cloud service providers, enterprise and government, and communications service providers. The company serves original equipment manufacturers, original design manufacturers, and cloud service providers. Intel Corporation has a strategic partnership with MILA to develop and apply advances in artificial intelligence methods for enhancing the search in the space of drugs. The company was incorporated in 1968 and is headquartered in Santa Clara, California. |
| Stock chart |
|---|
 |
| Financial Analysis | |
|---|---|
| Price to Book Value: | Neutral |
| P/BV, a ratio used to compare book value to its current market price, to gauge whether a stock is valued properly. | |
| Price to Earnings: | Outperform |
| PE, the ratio for valuing a company that measures its current share price relative to its earnings per share (EPS). | |
| Discounted cash flow: | Underperform |
| DCF, a valuation method used to estimate the value of an investment based on its expected future cash flows. | |
| Return on Assets: | Outperform |
| ROA, indicates how profitable a company is in relation to its total assets, how efficiently uses assets to generate a profit. | |
| Return on Equity: | Outperform |
| ROE, a measure of financial performance calculated by dividing net income by equity. a gauge of profitability and efficiency. | |
| Debt to Equity: | Outperform |
| evaluate financial leverage, reflects the ability of equity to cover outstanding debts in the event of a business downturn. | |
| Stock Basics & Statistics | |
|---|---|
| Exchange: NASDAQ Global Select | |
| Sector: Technology | |
| Industry: Semiconductors | |
| Shares Out. (M) | 4260.00 |
| Shares Float (M) | 4220.00 |
| % Held by Insiders | 0.06 |
| % Held by Institutions | 67.75 |
| Shares Short (K) | 72400 |
| Shares Short Prior Month (K) | 68800 |
| Stock Financials | |
|---|---|
| EPS | 0.400 |
| Book Value (p.s.) | 24.970 |
| Profit Margin | 3.12 |
| Operating Margin | 9.37 |
| Return on Assets (ttm) | |
| Return on Equity (ttm) | 1.6 |
| Qtrly Rev. Growth | 9.7 |
| Gross Profit (p.s.) | |
| Sales Per Share | 12.730 |
| EBITDA (p.s.) | 2.261 |
| Qtrly Earnings Growth | |
| Operating Cash Flow (M) | 11470.00 |
| Levered Free Cash Flow (M) | -11800.00 |
| Stock Valuation | |
|---|---|
| PE Ratio | 77.80 |
| PEG Ratio | 0.69 |
| Price to Book value | 1.25 |
| Price to Sales | 2.44 |
| Price to Cash Flow | 11.56 |
| Stock Dividends | |
|---|---|
| Dividend | 0.120 |
| Dividend Yield | |
| Dividend Growth | |


