| Iterum Therapeutics Plc (ITRM) | |||
|---|---|---|---|
| 1.58 0.02 (1.28%) | 04-26 11:50 | ||
| Open: | 1.59 | Pre. Close: | 1.56 |
| High: | 1.641 | Low: | 1.52 |
| Volume: | 33,551 | Market Cap: | 26(M) |
| Stock Technical Analysis | |
|---|---|
| Overall: |  |
| Target: | Six months: 2.03 One year: 2.25 |
| Support: | Support1: 1.42 Support2: 1.18 |
| Resistance: | Resistance1: 1.74 Resistance2: 1.93 |
| Pivot: | 1.56 |
| Moving Averages: | MA(5): 1.57 MA(20): 1.59 MA(100): 1.65 MA(250): 1.27 |
| MACD: | MACD(12,26): -0.01 Signal(12,26,9): |
| %K %D: | %K(14,3): 32.62 %D(3): 30.87 |
| RSI: | RSI(14): 50.65 |
| 52-Week: | High: 2.5 Low: 0.622 Change(%): 34.2 |
| Average Vol(K): | 3-Month: 210 10-Days: 81 |
| Prices Prediction (Update @5:00pm) | ||
|---|---|---|
| If tomorrow: | Open lower | Open higher |
| High: | 1.571 - 1.579 | 1.579 - 1.586 |
| Low: | 1.492 - 1.5 | 1.5 - 1.508 |
| Close: | 1.557 - 1.57 | 1.57 - 1.583 |
| Price, MAs and Bollinger Bands |
|---|
| Price has closed below its short-term moving average. Short-term moving average is currently above mid-term; and below long-term moving average. From the relationship between price and moving averages: This stock is NEUTRAL in short-term; and NEUTRAL in mid-long term.[ ITRM ] has closed below upper band by 47.4%. Bollinger Bands are 40.7% narrower than normal. The narrow width of the bands suggests low volatility as compared to its normal range. The bands have been in this narrow range for 0 bars. This is a sign that the market may be about to initiate a new trend. |
| Company profile |
|---|
| Iterum Therapeutics plc, a clinical-stage pharmaceutical company, engages in developing and commercializing anti-infectives in Ireland, Bermuda, and the United States. It is developing sulopenem, a novel anti-infective compound with oral and IV formulations that is in Phase III clinical trials for the treatment of uncomplicated urinary tract infections, complicated urinary tract infections, and complicated intra-abdominal infections. The company was incorporated in 2015 and is headquartered in Dublin, Ireland. |
| Stock chart |
|---|
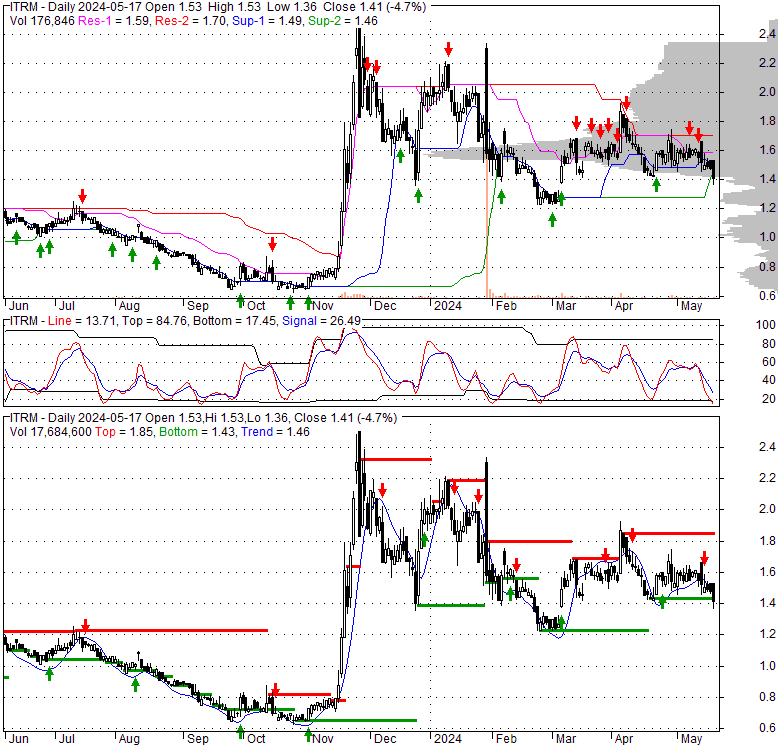 |
| Financial Analysis | |
|---|---|
| Price to Book Value: | Underperform |
| P/BV, a ratio used to compare book value to its current market price, to gauge whether a stock is valued properly. | |
| Price to Earnings: | Neutral |
| PE, the ratio for valuing a company that measures its current share price relative to its earnings per share (EPS). | |
| Discounted cash flow: | Underperform |
| DCF, a valuation method used to estimate the value of an investment based on its expected future cash flows. | |
| Return on Assets: | Underperform |
| ROA, indicates how profitable a company is in relation to its total assets, how efficiently uses assets to generate a profit. | |
| Return on Equity: | Outperform |
| ROE, a measure of financial performance calculated by dividing net income by equity. a gauge of profitability and efficiency. | |
| Debt to Equity: | Underperform |
| evaluate financial leverage, reflects the ability of equity to cover outstanding debts in the event of a business downturn. | |
| Stock Basics & Statistics | |
|---|---|
| Exchange: NASDAQ Capital Market | |
| Sector: Healthcare | |
| Industry: Biotechnology | |
| Shares Out. (M) | 16.43 |
| Shares Float (M) | 15.34 |
| % Held by Insiders | 1.52 |
| % Held by Institutions | 7.56 |
| Shares Short (K) | 1230 |
| Shares Short Prior Month (K) | 975 |
| Stock Financials | |
|---|---|
| EPS | -2.960 |
| Book Value (p.s.) | -0.470 |
| Profit Margin | |
| Operating Margin | |
| Return on Assets (ttm) | -63.7 |
| Return on Equity (ttm) | -355.4 |
| Qtrly Rev. Growth | |
| Gross Profit (p.s.) | |
| Sales Per Share | |
| EBITDA (p.s.) | -2.783 |
| Qtrly Earnings Growth | |
| Operating Cash Flow (M) | -39.33 |
| Levered Free Cash Flow (M) | -22.38 |
| Stock Valuation | |
|---|---|
| PE Ratio | -0.53 |
| PEG Ratio | |
| Price to Book value | -3.34 |
| Price to Sales | |
| Price to Cash Flow | -0.66 |
| Stock Dividends | |
|---|---|
| Dividend | |
| Dividend Yield | |
| Dividend Growth | |


