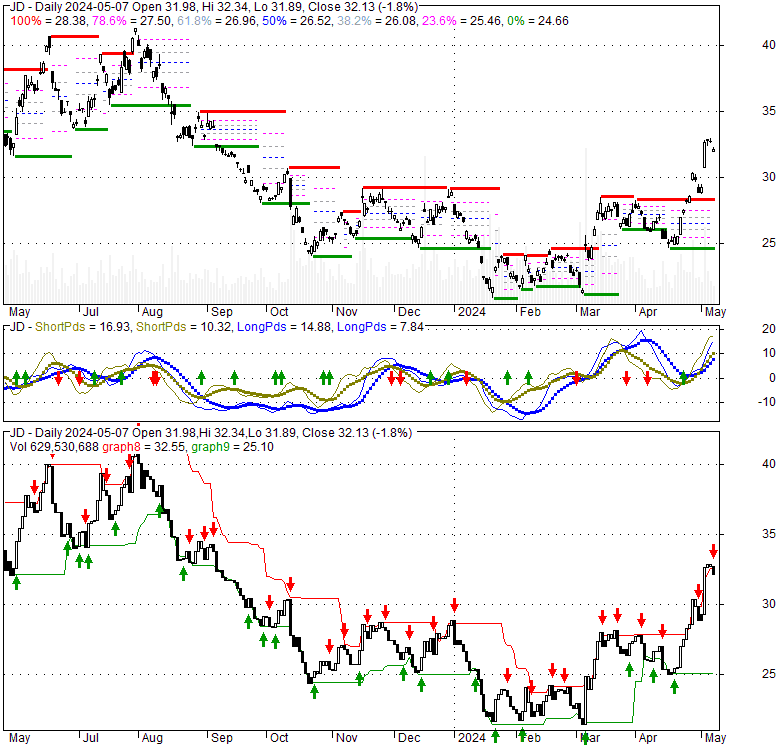
| Jd.com Inc ADR (JD) | |||
|---|---|---|---|
| 30.34 1.75 (6.12%) | 04-26 16:00 | ||
| Open: | 29.89 | Pre. Close: | 28.59 |
| High: | 30.46 | Low: | 29.73 |
| Volume: | 22,044,630 | Market Cap: | 38,739(M) |
| Stock Technical Analysis | |
|---|---|
| Overall: |  |
| Target: | Six months: 35.58 One year: 41.55 |
| Support: | Support1: 26.88 Support2: 24.66 |
| Resistance: | Resistance1: 30.46 Resistance2: 35.58 |
| Pivot: | 26.67 |
| Moving Averages: | MA(5): 28.35 MA(20): 26.75 MA(100): 25.40 MA(250): 29.88 |
| MACD: | MACD(12,26): 0.65 Signal(12,26,9): 0.28 |
| %K %D: | %K(14,3): 97.16 %D(3): 93.69 |
| RSI: | RSI(14): 72.24 |
| 52-Week: | High: 41.953 Low: 20.82 Change(%): -15.1 |
| Average Vol(K): | 3-Month: 14183 10-Days: 12148 |
| Prices Prediction (Update @5:00pm) | ||
|---|---|---|
| If tomorrow: | Open lower | Open higher |
| High: | 30.478 - 30.568 | 30.568 - 30.669 |
| Low: | 29.456 - 29.566 | 29.566 - 29.689 |
| Close: | 30.144 - 30.312 | 30.312 - 30.5 |
| Price, MAs and Bollinger Bands |
|---|
| Price has closed above its short-term moving average. Short-term moving average is currently above mid-term; and above long-term moving average. From the relationship between price and moving averages: This stock is BULLISH in short-term; and BULLISH in mid-long term.[ JD ] has closed Bollinger Bands are 38.9% wider than normal. The current width of the bands does not suggest anything about the future direction or movement of prices. |
| Company profile |
|---|
| JD.com, Inc. provides supply chain-based technologies and services in the People's Republic of China. The company offers computers, communication, and consumer electronics products, as well as home appliances; and general merchandise products comprising food, beverage and fresh produce, baby and maternity products, furniture and household goods, cosmetics and other personal care items, pharmaceutical and healthcare products, books, automobile accessories, apparel and footwear, bags, and jewelry. It also provides online marketplace services for third-party merchants; marketing services; and omni-channel solutions to customers and offline retailers, as well as online healthcare services. In addition, the company develops, owns, and manages its logistics facilities and other real estate properties to support third parties; and provides asset management services for logistics property investors. Further, it provides integrated data, technology, business, and user management industry solutions to support the digitization of enterprises and institutions. The company was formerly known as 360buy Jingdong Inc. and changed its name to JD.com, Inc. in January 2014. JD.com, Inc. was incorporated in 2006 and is headquartered in Beijing, the People's Republic of China. |
| Stock chart |
|---|
 |
| Financial Analysis | |
|---|---|
| Price to Book Value: | Neutral |
| P/BV, a ratio used to compare book value to its current market price, to gauge whether a stock is valued properly. | |
| Price to Earnings: | Outperform |
| PE, the ratio for valuing a company that measures its current share price relative to its earnings per share (EPS). | |
| Discounted cash flow: | Outperform |
| DCF, a valuation method used to estimate the value of an investment based on its expected future cash flows. | |
| Return on Assets: | Neutral |
| ROA, indicates how profitable a company is in relation to its total assets, how efficiently uses assets to generate a profit. | |
| Return on Equity: | Underperform |
| ROE, a measure of financial performance calculated by dividing net income by equity. a gauge of profitability and efficiency. | |
| Debt to Equity: | Neutral |
| evaluate financial leverage, reflects the ability of equity to cover outstanding debts in the event of a business downturn. | |
| Stock Basics & Statistics | |
|---|---|
| Exchange: NASDAQ Global Select | |
| Sector: Consumer Cyclical | |
| Industry: Specialty Retail | |
| Shares Out. (M) | 1530.00 |
| Shares Float (M) | 2390.00 |
| % Held by Insiders | 5.32 |
| % Held by Institutions | 16.97 |
| Shares Short (K) | 33580 |
| Shares Short Prior Month (K) | 25620 |
| Stock Financials | |
|---|---|
| EPS | 2.100 |
| Book Value (p.s.) | 147.790 |
| Profit Margin | 2.23 |
| Operating Margin | 2.09 |
| Return on Assets (ttm) | 3.0 |
| Return on Equity (ttm) | 8.1 |
| Qtrly Rev. Growth | 3.6 |
| Gross Profit (p.s.) | |
| Sales Per Share | |
| EBITDA (p.s.) | 24.314 |
| Qtrly Earnings Growth | 17.80 |
| Operating Cash Flow (M) | 59520.00 |
| Levered Free Cash Flow (M) | 23480.00 |
| Stock Valuation | |
|---|---|
| PE Ratio | 14.45 |
| PEG Ratio | 23.78 |
| Price to Book value | 0.21 |
| Price to Sales | 42981666816.00 |
| Price to Cash Flow | 0.78 |
| Stock Dividends | |
|---|---|
| Dividend | 0.760 |
| Dividend Yield | 0.03 |
| Dividend Growth | |