| Just Energy Group Inc (JE) | |||
|---|---|---|---|
| 1.745 0 (0%) | 12-31 19:00 | ||
| Open: | 1.82 | Pre. Close: | 1.78 |
| High: | 1.86 | Low: | 1.7 |
| Volume: | 1,427,863 | Market Cap: | 0(M) |
| Stock Technical Analysis | |
|---|---|
| Overall: |  |
| Target: | Six months: 3.51 One year: 5.05 |
| Support: | Support1: 0.87 Support2: 0.72 |
| Resistance: | Resistance1: 3.00 Resistance2: 4.32 |
| Pivot: | 1.32 |
| Moving Averages: | MA(5): 0.94 MA(20): 1.45 MA(100): 4.50 MA(250): 204.80 |
| MACD: | MACD(12,26): -0.80 Signal(12,26,9): -0.87 |
| %K %D: | %K(14,3): 7.11 %D(3): 7.70 |
| RSI: | RSI(14): 21.83 |
| 52-Week: | High: 1.86 Low: 0.072 Change(%): -99.8 |
| Average Vol(K): | 3-Month: 414488 10-Days: 13558 |
| Prices Prediction (Update @5:00pm) | ||
|---|---|---|
| If tomorrow: | Open lower | Open higher |
| High: | 1.002 - 1.008 | 1.008 - 1.014 |
| Low: | 0.856 - 0.861 | 0.861 - 0.868 |
| Close: | 0.869 - 0.879 | 0.879 - 0.89 |
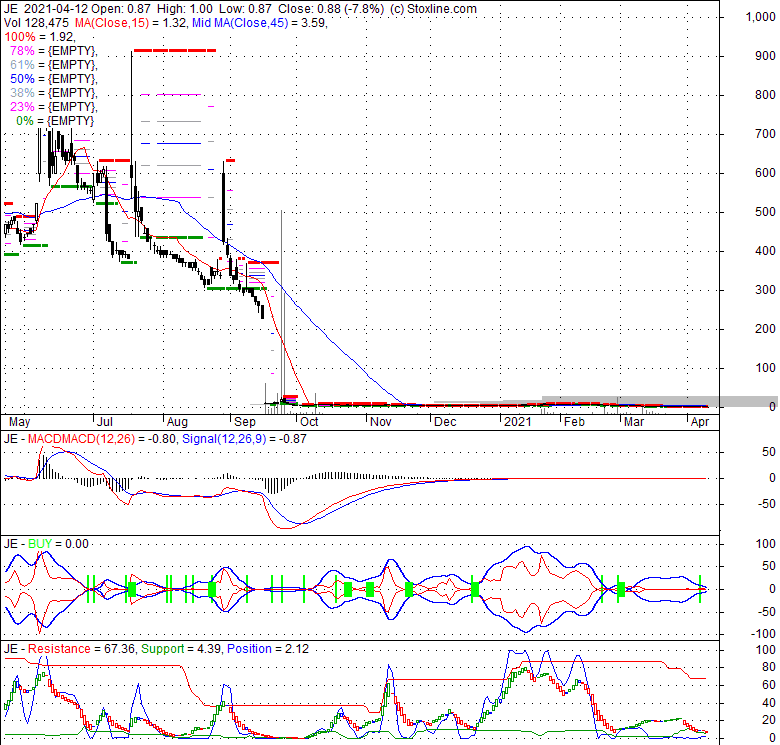
| Price, MAs and Bollinger Bands |
|---|
| Price and moving averages has closed below its Short term moving average. Short term moving average is currently below mid-term; AND below long term moving averages. From the relationship between price and moving averages; we can see that: This stock is BEARISH in short-term; and BEARISH in mid-long term.JE has closed above bottom band by 22.0%. Bollinger Bands are 29.4% narrower than normal. The current width of the bands does not suggest anything about the future direction or movement of prices. |
| Company profile |
|---|
| Just Energy Group Inc., through its subsidiaries, provides electricity and natural gas commodities in the United States, Canada, and internationally. It operates through Consumer and Commercial segments. The company offers longer-term price-protected, flat-bill, and variable rate product offerings, as well as Just Green products; smart thermostats; and subscription-based home water filtration systems, including under-counter and whole-home water filtration solution It also provides business electricity and natural gas plans, LED retrofit solutions, smart building controls, commercial energy rates, affinity programs, energy monitoring and sub-metering products, energy analytics solutions, HVAC control system, and lighting controls. The company serves residential and commercial customers through brokers, door-to-door commercial independent contractors, and inside commercial sales representatives. Just Energy Group Inc. was founded in 1997 and is based in Toronto, Canada. |
| Stock chart |
|---|
 |
| Financial Analysis | |
|---|---|
| Price to Book Value: | Neutral |
| P/BV, a ratio used to compare book value to its current market price, to gauge whether a stock is valued properly. | |
| Price to Earnings: | Neutral |
| PE, the ratio for valuing a company that measures its current share price relative to its earnings per share (EPS). | |
| Discounted cash flow: | Outperform |
| DCF, a valuation method used to estimate the value of an investment based on its expected future cash flows. | |
| Return on Assets: | Neutral |
| ROA, indicates how profitable a company is in relation to its total assets, how efficiently uses assets to generate a profit. | |
| Return on Equity: | Outperform |
| ROE, a measure of financial performance calculated by dividing net income by equity. a gauge of profitability and efficiency. | |
| Debt to Equity: | Outperform |
| evaluate financial leverage, reflects the ability of equity to cover outstanding debts in the event of a business downturn. | |
| Stock Basics & Statistics | |
|---|---|
| Exchange: New York Stock Exchange | |
| Sector: Utilities | |
| Industry: Independent Power Producers | |
| Shares Out. (M) | |
| Shares Float (M) | |
| % Held by Insiders | |
| % Held by Institutions | |
| Shares Short (K) | |
| Shares Short Prior Month (K) | |
| Stock Financials | |
|---|---|
| EPS | |
| Book Value (p.s.) | |
| Profit Margin | |
| Operating Margin | |
| Return on Assets (ttm) | |
| Return on Equity (ttm) | |
| Qtrly Rev. Growth | |
| Gross Profit (p.s.) | 13.235 |
| Sales Per Share | |
| EBITDA (p.s.) | |
| Qtrly Earnings Growth | |
| Operating Cash Flow (M) | |
| Levered Free Cash Flow (M) | |
| Stock Valuation | |
|---|---|
| PE Ratio | |
| PEG Ratio | |
| Price to Book value | |
| Price to Sales | |
| Price to Cash Flow | |
| Stock Dividends | |
|---|---|
| Dividend | 0.380 |
| Dividend Yield | 0.43 |
| Dividend Growth | |


