| Karuna Therapeutics Inc (KRTX) | |||
|---|---|---|---|
| 329.83 0.09 (0.03%) | 03-15 16:00 | ||
| Open: | 329.75 | Pre. Close: | 329.74 |
| High: | 329.97 | Low: | 329.75 |
| Volume: | 1,283,005 | Market Cap: | 12,599(M) |
| Stock Technical Analysis | |
|---|---|
| Overall: |  |
| Target: | Six months: 385.40 One year: 450.15 |
| Support: | Support1: 309.01 Support2: 296.06 |
| Resistance: | Resistance1: 329.97 Resistance2: 385.40 |
| Pivot: | 320.43 |
| Moving Averages: | MA(5): 326.74 MA(20): 319.98 MA(100): 263.31 MA(250): 223.22 |
| MACD: | MACD(12,26): 4.15 Signal(12,26,9): 3.41 |
| %K %D: | %K(14,3): 99.51 %D(3): 98.31 |
| RSI: | RSI(14): 75.40 |
| 52-Week: | High: 329.99 Low: 158.375 Change(%): 80.7 |
| Average Vol(K): | 3-Month: 958 10-Days: 721 |
| Prices Prediction (Update @5:00pm) | ||
|---|---|---|
| If tomorrow: | Open lower | Open higher |
| High: | 330.216 - 331.955 | 331.955 - 333.435 |
| Low: | 325.608 - 327.628 | 327.628 - 329.345 |
| Close: | 326.542 - 329.94 | 329.94 - 332.831 |
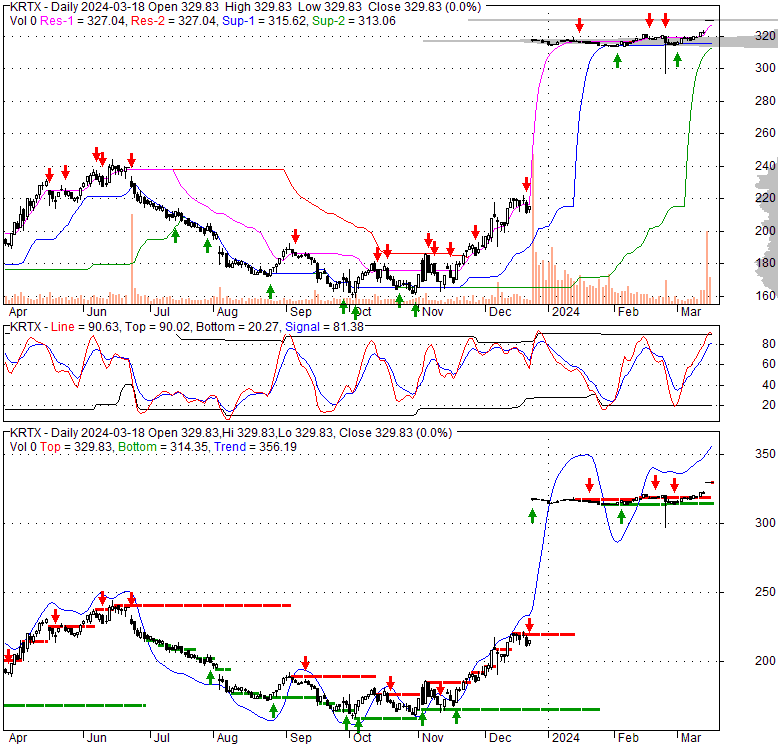
| Price, MAs and Bollinger Bands |
|---|
| Price has closed above its short-term moving average. Short-term moving average is currently above mid-term; and above long-term moving average. From the relationship between price and moving averages: This stock is BULLISH in short-term; and BULLISH in mid-long term.[ KRTX ] has closed below upper band by 4.8%. Bollinger Bands are 46.5% narrower than normal. The narrow width of the bands suggests low volatility as compared to its normal range. The bands have been in this narrow range for 43 bars. This is a sign that the market may be about to initiate a new trend. |
| Company profile |
|---|
| Karuna Therapeutics, Inc., a clinical-stage biopharmaceutical company, creates and delivers transformative medicines for people living with psychiatric and neurological conditions. Its lead product candidate is KarXT, an oral modulator of muscarinic receptors that is in Phase III clinical trial for the treatment of acute psychosis in patients with schizophrenia; and for the treatment of central nervous system disorders, such as negative and cognitive symptoms of schizophrenia and psychosis, as well as for the treatment of dementia-related psychosis. The company also focuses on developing other muscarinic-targeted drug candidates. Karuna Therapeutics, Inc. has a license agreement with Eli Lilly and Company, and Zai Lab (Shanghai) Co., Ltd; patent license agreement with PureTech Health LLC; and drug discovery partnership with Charles River Laboratories, as well as drug discovery collaboration with PsychoGenics, Inc. The company was formerly known as Karuna Pharmaceuticals, Inc. and changed its name to Karuna Therapeutics, Inc. in March 2019. Karuna Therapeutics, Inc. was incorporated in 2009 and is headquartered in Boston, Massachusetts. |
| Stock chart |
|---|
 |
| Financial Analysis | |
|---|---|
| Price to Book Value: | Outperform |
| P/BV, a ratio used to compare book value to its current market price, to gauge whether a stock is valued properly. | |
| Price to Earnings: | Underperform |
| PE, the ratio for valuing a company that measures its current share price relative to its earnings per share (EPS). | |
| Discounted cash flow: | Neutral |
| DCF, a valuation method used to estimate the value of an investment based on its expected future cash flows. | |
| Return on Assets: | Neutral |
| ROA, indicates how profitable a company is in relation to its total assets, how efficiently uses assets to generate a profit. | |
| Return on Equity: | Underperform |
| ROE, a measure of financial performance calculated by dividing net income by equity. a gauge of profitability and efficiency. | |
| Debt to Equity: | Underperform |
| evaluate financial leverage, reflects the ability of equity to cover outstanding debts in the event of a business downturn. | |
| Stock Basics & Statistics | |
|---|---|
| Exchange: NASDAQ Global Market | |
| Sector: Healthcare | |
| Industry: Biotechnology | |
| Shares Out. (M) | |
| Shares Float (M) | 38.20 |
| % Held by Insiders | 36270000.00 |
| % Held by Institutions | 4.99 |
| Shares Short (K) | 1690 |
| Shares Short Prior Month (K) | |
| Stock Financials | |
|---|---|
| EPS | -492489984.000 |
| Book Value (p.s.) | |
| Profit Margin | |
| Operating Margin | -75.00 |
| Return on Assets (ttm) | 564.1 |
| Return on Equity (ttm) | -24.7 |
| Qtrly Rev. Growth | 654000.0 |
| Gross Profit (p.s.) | -86.957 |
| Sales Per Share | -31.687 |
| EBITDA (p.s.) | |
| Qtrly Earnings Growth | -11.74 |
| Operating Cash Flow (M) | |
| Levered Free Cash Flow (M) | -385.82 |
| Stock Valuation | |
|---|---|
| PE Ratio | |
| PEG Ratio | 0.33 |
| Price to Book value | |
| Price to Sales | -10.41 |
| Price to Cash Flow | 11.52 |
| Stock Dividends | |
|---|---|
| Dividend | |
| Dividend Yield | |
| Dividend Growth | 1970000.000 |


