| Lazard Inc (LAZ) | |||
|---|---|---|---|
| 38.99 0.1 (0.26%) | 04-26 16:00 | ||
| Open: | 38.72 | Pre. Close: | 38.89 |
| High: | 39.26 | Low: | 38.32 |
| Volume: | 798,052 | Market Cap: | 3,408(M) |
| Stock Technical Analysis | |
|---|---|
| Overall: |  |
| Target: | Six months: 46.92 One year: 49.34 |
| Support: | Support1: 36.82 Support2: 30.63 |
| Resistance: | Resistance1: 40.17 Resistance2: 42.24 |
| Pivot: | 38.90 |
| Moving Averages: | MA(5): 39.06 MA(20): 39.31 MA(100): 38.01 MA(250): 33.84 |
| MACD: | MACD(12,26): -0.24 Signal(12,26,9): -0.24 |
| %K %D: | %K(14,3): 45.71 %D(3): 47.73 |
| RSI: | RSI(14): 48.85 |
| 52-Week: | High: 42.24 Low: 25.82 Change(%): 24.6 |
| Average Vol(K): | 3-Month: 1142 10-Days: 939 |
| Prices Prediction (Update @5:00pm) | ||
|---|---|---|
| If tomorrow: | Open lower | Open higher |
| High: | 39.28 - 39.473 | 39.473 - 39.669 |
| Low: | 37.865 - 38.066 | 38.066 - 38.269 |
| Close: | 38.666 - 38.985 | 38.985 - 39.309 |
| Price, MAs and Bollinger Bands |
|---|
| Price has closed below its short-term moving average. Short-term moving average is currently below mid-term; and above long-term moving average. From the relationship between price and moving averages: This stock is BEARISH in short-term; and NEUTRAL in mid-long term.[ LAZ ] has closed below upper band by 48.1%. Bollinger Bands are 14.1% wider than normal. The current width of the bands does not suggest anything about the future direction or movement of prices. |
| Company profile |
|---|
| Lazard Ltd, together with its subsidiaries, operates as a financial advisory and asset management firm in North America, Europe, Asia, Australia, and Central and South America. It operates in two segments, Financial Advisory and Asset Management. The Financial Advisory segment offers various financial advisory services regarding mergers and acquisitions, restructurings, capital advisory, shareholder advisory, capital raising, sovereign advisory, and other strategic advisory matters. This segment serves corporate, partnership, institutional, government, sovereign, and individual clients across various industry areas, including consumers, financial institutions, healthcare and life sciences, industrials, power and energy/infrastructure, and real estate, as well as technology, telecommunication, and media and entertainment. The Asset Management segment offers a range of investment solutions, and investment and wealth management services in equity and fixed income strategies; asset allocation strategies; and alternative investments and private equity funds to corporations, public funds, sovereign entities, endowments and foundations, labor funds, financial intermediaries, and private clients. The company was founded in 1848 and is based in Hamilton, Bermuda. |
| Stock chart |
|---|
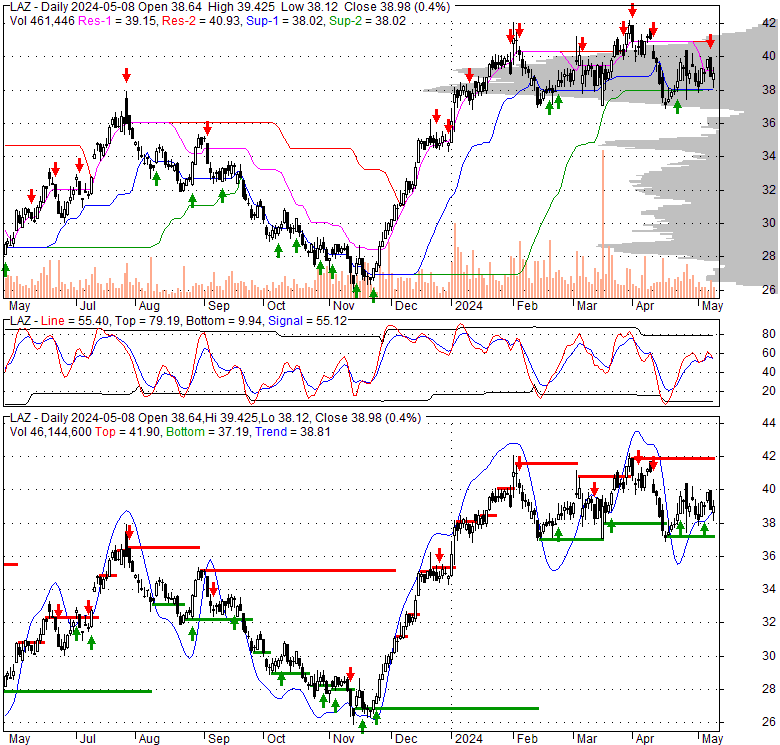 |
| Financial Analysis | |
|---|---|
| Price to Book Value: | Outperform |
| P/BV, a ratio used to compare book value to its current market price, to gauge whether a stock is valued properly. | |
| Price to Earnings: | Outperform |
| PE, the ratio for valuing a company that measures its current share price relative to its earnings per share (EPS). | |
| Discounted cash flow: | Outperform |
| DCF, a valuation method used to estimate the value of an investment based on its expected future cash flows. | |
| Return on Assets: | Outperform |
| ROA, indicates how profitable a company is in relation to its total assets, how efficiently uses assets to generate a profit. | |
| Return on Equity: | Outperform |
| ROE, a measure of financial performance calculated by dividing net income by equity. a gauge of profitability and efficiency. | |
| Debt to Equity: | Outperform |
| evaluate financial leverage, reflects the ability of equity to cover outstanding debts in the event of a business downturn. | |
| Stock Basics & Statistics | |
|---|---|
| Exchange: New York Stock Exchange | |
| Sector: Financial Services | |
| Industry: Financial - Capital Markets | |
| Shares Out. (M) | 87.43 |
| Shares Float (M) | 83.99 |
| % Held by Insiders | 3.46 |
| % Held by Institutions | 55.45 |
| Shares Short (K) | 2120 |
| Shares Short Prior Month (K) | 3100 |
| Stock Financials | |
|---|---|
| EPS | -0.900 |
| Book Value (p.s.) | 4.850 |
| Profit Margin | -2.99 |
| Operating Margin | 10.88 |
| Return on Assets (ttm) | -1.1 |
| Return on Equity (ttm) | -6.3 |
| Qtrly Rev. Growth | 12.4 |
| Gross Profit (p.s.) | |
| Sales Per Share | 28.823 |
| EBITDA (p.s.) | |
| Qtrly Earnings Growth | 46.60 |
| Operating Cash Flow (M) | 164.66 |
| Levered Free Cash Flow (M) | |
| Stock Valuation | |
|---|---|
| PE Ratio | -43.32 |
| PEG Ratio | 1.72 |
| Price to Book value | 8.04 |
| Price to Sales | 1.35 |
| Price to Cash Flow | 20.70 |
| Stock Dividends | |
|---|---|
| Dividend | |
| Dividend Yield | |
| Dividend Growth | |


