
| Levi Strauss & Company Cl A (LEVI) | |||
|---|---|---|---|
| 21.36 0.43 (2.05%) | 10-22 16:00 | ||
| Open: | 20.84 | Pre. Close: | 20.93 |
| High: | 21.475 | Low: | 20.84 |
| Volume: | 2,673,922 | Market Cap: | 8,191(M) |
| Stock Technical Analysis | |
|---|---|
| Overall: |  |
| Target: | Six months: 25.08  One year: 29.30 |
| Support: | Support1: 19.54 Support2: 18.35 |
| Resistance: | Resistance1: 21.48 Resistance2: 25.08 |
| Pivot: | 20.07 |
| Moving Averages: | MA(5): 20.84 MA(20): 20.00 MA(100): 22.21  MA(250): 21.39 |
| MACD: | MACD(12,26): 0.11 Signal(12,26,9): -0.14 |
| %K %D: | %K(14,3): 93.64 %D(3): 90.79 |
| RSI: | RSI(14): 63.28 |
| 52-Week: | High: 25.7 Low: 17.72 Change(%): 2.0 |
| Average Vol(K): | 3-Month: 3215 10-Days: 5042 |
| Prices Prediction (Update @5:00pm) | ||
|---|---|---|
| If tomorrow: | Open lower | Open higher |
| High: | 21.482 - 21.557 | 21.557 - 21.625 |
| Low: | 20.625 - 20.721 | 20.721 - 20.809 |
| Close: | 21.206 - 21.341 | 21.341 - 21.465 |
| Price, MAs and Bollinger Bands |
|---|
| Price has closed above its short-term moving average. Short-term moving average is currently above mid-term; and below long-term moving average. From the relationship between price and moving averages: This stock is BULLISH in short-term; and NEUTRAL in mid-long term.[ LEVI ] has closed below upper band by 7.5%. Bollinger Bands are 34.6% wider than normal. The current width of the bands does not suggest anything about the future direction or movement of prices. |
| Company profile |
|---|
| Levi Strauss & Co. stands as a prominent global clothing enterprise, actively involved in the conceptualization, promotion, and distribution of an extensive collection of apparel and related accessories. Their comprehensive product line includes denim, casual and formal trousers, athletic wear, tops, shorts, skirts, dresses, jackets, footwear, and various other accessories, all designed to appeal to men, women, and children across the Americas, Europe, and Asia. The company markets its offerings under several renowned brands, such as Levi's, Dockers, Signature by Levi Strauss & Co., and Denizen. Furthermore, Levi Strauss & Co. extends its reach by granting licenses for its Levi's and Dockers trademarks to be utilized across an expanded array of product categories, including footwear, belts, small leather goods, outerwear, knitwear, dress shirts, children's apparel, sleepwear, and hosiery. The distribution of its merchandise occurs through a multifaceted approach: via independent retailers like major department stores, specialized boutiques, third-party e-commerce platforms, and franchised outlets dedicated to its brands. Concurrently, the company fosters a direct relationship with consumers through its own network of mainline and clearance stores, proprietary online sales portals, and select in-store concessions situated within larger retail environments. In total, Levi Strauss & Co. directly manages approximately 3,100 brand-specific stores and shop-in-shops. Established in 1853, the firm maintains its corporate headquarters in San Francisco, California. |
| Stock chart |
|---|
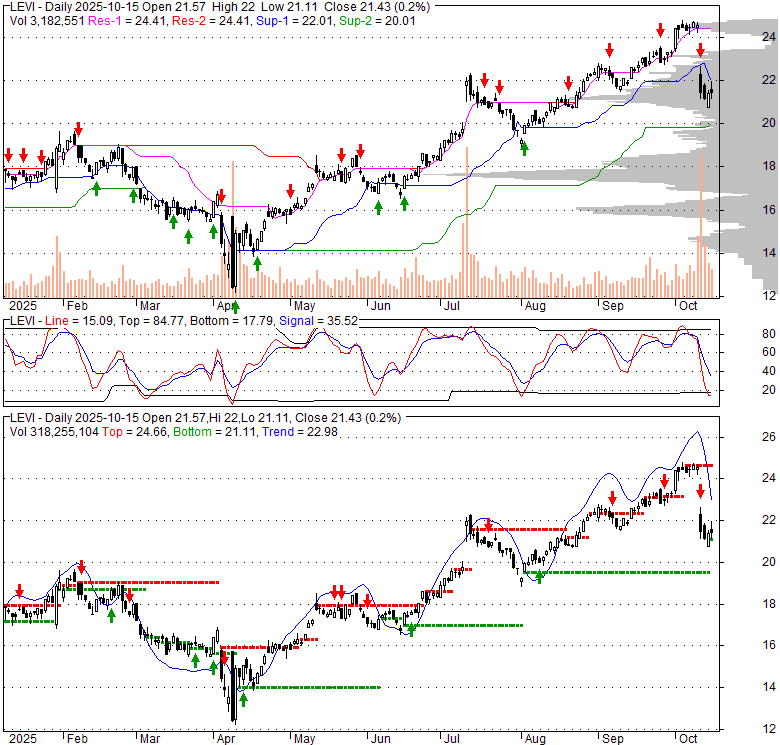 |
| Financial Analysis | |
|---|---|
| Price to Book Value: | Underperform |
| P/BV, a ratio used to compare book value to its current market price, to gauge whether a stock is valued properly. | |
| Price to Earnings: | Neutral |
| PE, the ratio for valuing a company that measures its current share price relative to its earnings per share (EPS). | |
| Discounted cash flow: | Underperform |
| DCF, a valuation method used to estimate the value of an investment based on its expected future cash flows. | |
| Return on Assets: | Outperform |
| ROA, indicates how profitable a company is in relation to its total assets, how efficiently uses assets to generate a profit. | |
| Return on Equity: | Outperform |
| ROE, a measure of financial performance calculated by dividing net income by equity. a gauge of profitability and efficiency. | |
| Debt to Equity: | Underperform |
| evaluate financial leverage, reflects the ability of equity to cover outstanding debts in the event of a business downturn. | |
| Stock Basics & Statistics | |
|---|---|
| Exchange: New York Stock Exchange | |
| Sector: Consumer Cyclical | |
| Industry: Apparel - Manufacturers | |
| Shares Out. (M) | 99.50 |
| Shares Float (M) | 92.01 |
| % Held by Insiders | 2.26 |
| % Held by Institutions | 91.41 |
| Shares Short (K) | 8650 |
| Shares Short Prior Month (K) | 7080 |
| Stock Financials | |
|---|---|
| EPS | 1.520 |
| Book Value (p.s.) | 5.910 |
| Profit Margin | 8.83 |
| Operating Margin | 10.39 |
| Return on Assets (ttm) | 6.6 |
| Return on Equity (ttm) | 26.3 |
| Qtrly Rev. Growth | 4.3 |
| Gross Profit (p.s.) | 41.407 |
| Sales Per Share | 67.136 |
| EBITDA (p.s.) | 9.424 |
| Qtrly Earnings Growth | -22.00 |
| Operating Cash Flow (M) | 852.00 |
| Levered Free Cash Flow (M) | 340.51 |
| Stock Valuation | |
|---|---|
| PE Ratio | 14.05 |
| PEG Ratio | |
| Price to Book value | 3.61 |
| Price to Sales | 0.32 |
| Price to Cash Flow | 2.49 |
| Stock Dividends | |
|---|---|
| Dividend | 0.160 |
| Dividend Yield | 0.01 |
| Dividend Growth | |


