| Lianbio ADR (LIAN) | |||
|---|---|---|---|
| 0.319 0 (0%) | 04-04 16:00 | ||
| Open: | 0.3121 | Pre. Close: | 0.319 |
| High: | 0.319 | Low: | 0.3121 |
| Volume: | 2,478,298 | Market Cap: | 34(M) |
| Stock Technical Analysis | |
|---|---|
| Overall: |  |
| Target: | Six months: 0.39 One year: 0.45 |
| Support: | Support1: 0.24 Support2: 0.20 |
| Resistance: | Resistance1: 0.33 Resistance2: 0.39 |
| Pivot: | 0.30 |
| Moving Averages: | MA(5): 0.29 MA(20): 0.31 MA(100): 3.37 MA(250): 2.74 |
| MACD: | MACD(12,26): -0.58 Signal(12,26,9): -0.74 |
| %K %D: | %K(14,3): 15.03 %D(3): 18.87 |
| RSI: | RSI(14): 10.76 |
| 52-Week: | High: 4.99 Low: 0.241 Change(%): -86.5 |
| Average Vol(K): | 3-Month: 955 10-Days: 70 |
| Prices Prediction (Update @5:00pm) | ||
|---|---|---|
| If tomorrow: | Open lower | Open higher |
| High: | 0.29 - 0.292 | 0.292 - 0.293 |
| Low: | 0.286 - 0.288 | 0.288 - 0.289 |
| Close: | 0.287 - 0.29 | 0.29 - 0.292 |
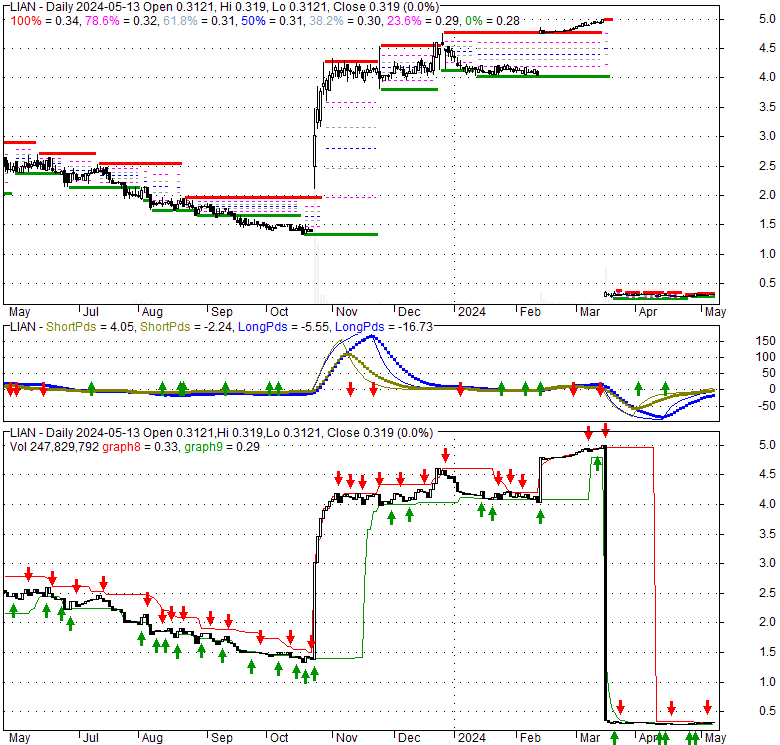
| Price, MAs and Bollinger Bands |
|---|
| Price has closed below its short-term moving average. Short-term moving average is currently below mid-term; and below long-term moving average. From the relationship between price and moving averages: This stock is BEARISH in short-term; and BEARISH in mid-long term.[ LIAN ] has closed above bottom band by 18.8%. Bollinger Bands are 96.7% narrower than normal. The narrow width of the bands suggests low volatility as compared to its normal range. The bands have been in this narrow range for 10 bars. This is a sign that the market may be about to initiate a new trend. |
| Company profile |
|---|
| LianBio, a biopharmaceutical company, engages in developing and commercializing medicines for cardiovascular, oncology, respiratory, opthalmology, and inflammatory diseases in China and other Asian countries. The company develops mavacamten for the treatment of obstructive and non-obstructive hypertrophic cardiomyopathy, and heart failure with preserved ejection fraction; TP-03 for the treatment of Demodex blepharitis; NBTXR3 for the treatment of head and neck squamous cell carcinoma, and solid tumor; Infigratinib for the treatment of second-line and first-line cholangiocarcinoma, and gastric cancers; BBP-398 for solid tumors; Omilancor for ulcerative colitis and Crohn's disease; NX-13 for ulcerative colitis; LYR-210 for chronic rhinosinusitis; and Sisunatovir for respiratory syncytical virus. It has a partnership with Tarsus Pharmaceuticals, Inc. to develop and commercialize TP-03, an eye solution for the treatment of Demodex blepharitis; and Nanobiotix S.A. to develop and commercialize NBTXR3, a radioenhancer designed to be injected directly into a malignant tumor prior to standard radiotherapy. The company was incorporated in 2019 and is headquartered in Princeton, New Jersey. |
| Stock chart |
|---|
 |
| Financial Analysis | |
|---|---|
| Price to Book Value: | Neutral |
| P/BV, a ratio used to compare book value to its current market price, to gauge whether a stock is valued properly. | |
| Price to Earnings: | Neutral |
| PE, the ratio for valuing a company that measures its current share price relative to its earnings per share (EPS). | |
| Discounted cash flow: | Outperform |
| DCF, a valuation method used to estimate the value of an investment based on its expected future cash flows. | |
| Return on Assets: | Neutral |
| ROA, indicates how profitable a company is in relation to its total assets, how efficiently uses assets to generate a profit. | |
| Return on Equity: | Underperform |
| ROE, a measure of financial performance calculated by dividing net income by equity. a gauge of profitability and efficiency. | |
| Debt to Equity: | Neutral |
| evaluate financial leverage, reflects the ability of equity to cover outstanding debts in the event of a business downturn. | |
| Stock Basics & Statistics | |
|---|---|
| Exchange: NASDAQ Global Market | |
| Sector: Healthcare | |
| Industry: Biotechnology | |
| Shares Out. (M) | 108.06 |
| Shares Float (M) | 25.38 |
| % Held by Insiders | 5.91 |
| % Held by Institutions | 78.99 |
| Shares Short (K) | 378 |
| Shares Short Prior Month (K) | 233 |
| Stock Financials | |
|---|---|
| EPS | -0.820 |
| Book Value (p.s.) | 1.890 |
| Profit Margin | |
| Operating Margin | |
| Return on Assets (ttm) | -21.7 |
| Return on Equity (ttm) | -32.4 |
| Qtrly Rev. Growth | |
| Gross Profit (p.s.) | |
| Sales Per Share | |
| EBITDA (p.s.) | -0.974 |
| Qtrly Earnings Growth | |
| Operating Cash Flow (M) | -83.53 |
| Levered Free Cash Flow (M) | -36.86 |
| Stock Valuation | |
|---|---|
| PE Ratio | -0.35 |
| PEG Ratio | 0.01 |
| Price to Book value | 0.15 |
| Price to Sales | |
| Price to Cash Flow | -0.38 |
| Stock Dividends | |
|---|---|
| Dividend | |
| Dividend Yield | |
| Dividend Growth | |


