| Lyondellbasell Industries NV (LYB) | |||
|---|---|---|---|
| 100.74 1.34 (1.35%) | 04-19 16:00 | ||
| Open: | 99.69 | Pre. Close: | 99.4 |
| High: | 100.82 | Low: | 99.17 |
| Volume: | 2,015,377 | Market Cap: | 32,785(M) |
| Stock Technical Analysis | |
|---|---|
| Overall: |  |
| Target: | Six months: 121.05 One year: 124.61 |
| Support: | Support1: 98.70 Support2: 82.12 |
| Resistance: | Resistance1: 103.64 Resistance2: 106.69 |
| Pivot: | 102.49 |
| Moving Averages: | MA(5): 99.89 MA(20): 102.26 MA(100): 97.41 MA(250): 95.00 |
| MACD: | MACD(12,26): -0.05 Signal(12,26,9): 0.56 |
| %K %D: | %K(14,3): 15.60 %D(3): 11.53 |
| RSI: | RSI(14): 47.77 |
| 52-Week: | High: 106.69 Low: 84.8 Change(%): 7.4 |
| Average Vol(K): | 3-Month: 2047 10-Days: 1475 |
| Prices Prediction (Update @5:00pm) | ||
|---|---|---|
| If tomorrow: | Open lower | Open higher |
| High: | 100.908 - 101.619 | 101.619 - 102.171 |
| Low: | 97.831 - 98.59 | 98.59 - 99.18 |
| Close: | 99.75 - 100.924 | 100.924 - 101.835 |
| Price, MAs and Bollinger Bands |
|---|
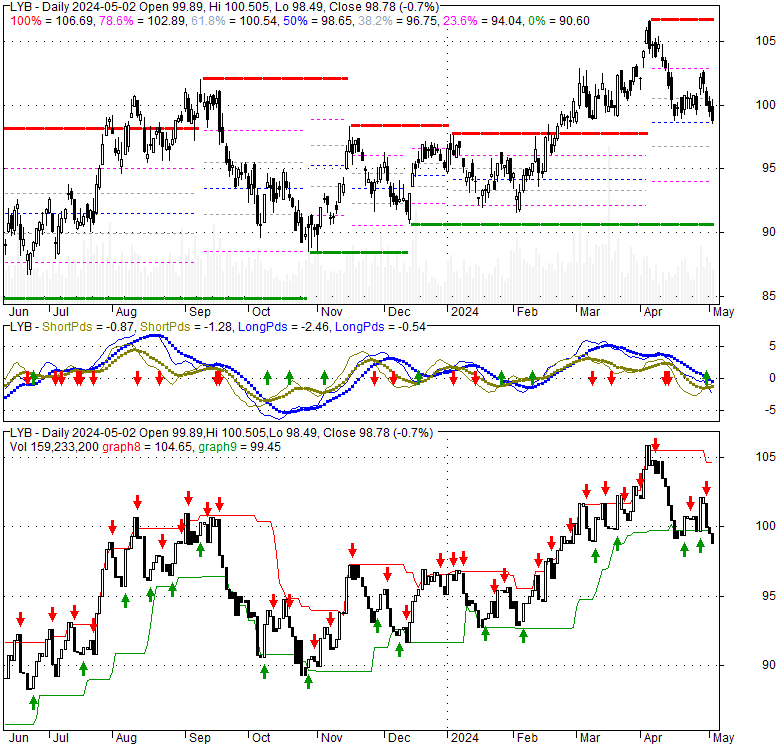
| Price has closed above its short-term moving average. Short-term moving average is currently below mid-term; and above long-term moving average. From the relationship between price and moving averages: This stock is NEUTRAL in short-term; and NEUTRAL in mid-long term.[ LYB ] has closed above bottom band by 29.5%. Bollinger Bands are 60.5% wider than normal. The large width of the bands suggest high volatility as compared to its normal range. The bands have been in this wide range for 2 days. This is a sign that the current trend might continue. |
| Company profile |
|---|
| LyondellBasell Industries N.V. operates as a chemical company in the United States, Germany, Mexico, Italy, Poland, France, Japan, China, the Netherlands, and internationally. The company operates in six segments: Olefins and PolyolefinsAmericas; Olefins and PolyolefinsEurope, Asia, International; Intermediates and Derivatives; Advanced Polymer Solutions; Refining; and Technology. It produces and markets olefins and co-products; polyolefins; polyethylene products, which consist of high density polyethylene, low density polyethylene, and linear low density polyethylene; and polypropylene (PP) products, such as PP homopolymers and copolymers. The company also produces and sells propylene oxide and its derivatives; oxyfuels and related products; and intermediate chemicals, such as styrene monomers, acetyls, ethylene glycols, and ethylene oxides and derivatives. In addition, it produces and markets compounds and solutions, such as polypropylene compounds, engineered plastics, masterbatches, engineered composites, colors, and powders; and advanced polymers. Further, the company refines crude oil and other crude oils of varied types and sources into gasoline and distillates; develops and licenses chemical and polyolefin process technologies; and manufactures and sells polyolefin catalysts. LyondellBasell Industries N.V. was incorporated in 2009 and is headquartered in Houston, Texas. |
| Stock chart |
|---|
 |
| Financial Analysis | |
|---|---|
| Price to Book Value: | Outperform |
| P/BV, a ratio used to compare book value to its current market price, to gauge whether a stock is valued properly. | |
| Price to Earnings: | Outperform |
| PE, the ratio for valuing a company that measures its current share price relative to its earnings per share (EPS). | |
| Discounted cash flow: | Outperform |
| DCF, a valuation method used to estimate the value of an investment based on its expected future cash flows. | |
| Return on Assets: | Outperform |
| ROA, indicates how profitable a company is in relation to its total assets, how efficiently uses assets to generate a profit. | |
| Return on Equity: | Outperform |
| ROE, a measure of financial performance calculated by dividing net income by equity. a gauge of profitability and efficiency. | |
| Debt to Equity: | Outperform |
| evaluate financial leverage, reflects the ability of equity to cover outstanding debts in the event of a business downturn. | |
| Stock Basics & Statistics | |
|---|---|
| Exchange: New York Stock Exchange | |
| Sector: Basic Materials | |
| Industry: Chemicals - Specialty | |
| Shares Out. (M) | 325.44 |
| Shares Float (M) | 258.63 |
| % Held by Insiders | 20.32 |
| % Held by Institutions | 72.49 |
| Shares Short (K) | 5520 |
| Shares Short Prior Month (K) | 5520 |
| Stock Financials | |
|---|---|
| EPS | 6.480 |
| Book Value (p.s.) | 39.850 |
| Profit Margin | 5.14 |
| Operating Margin | 5.37 |
| Return on Assets (ttm) | 6.0 |
| Return on Equity (ttm) | 16.4 |
| Qtrly Rev. Growth | -2.7 |
| Gross Profit (p.s.) | |
| Sales Per Share | 126.321 |
| EBITDA (p.s.) | 15.087 |
| Qtrly Earnings Growth | -47.60 |
| Operating Cash Flow (M) | 4940.00 |
| Levered Free Cash Flow (M) | 2070.00 |
| Stock Valuation | |
|---|---|
| PE Ratio | 15.55 |
| PEG Ratio | 1.48 |
| Price to Book value | 2.53 |
| Price to Sales | 0.80 |
| Price to Cash Flow | 6.64 |
| Stock Dividends | |
|---|---|
| Dividend | |
| Dividend Yield | |
| Dividend Growth | |