| Mattel Inc (MAT) | |||
|---|---|---|---|
| 18.45 0.02 (0.11%) | 05-03 16:00 | ||
| Open: | 18.52 | Pre. Close: | 18.43 |
| High: | 18.75 | Low: | 18.45 |
| Volume: | 2,206,102 | Market Cap: | 6,349(M) |
| Stock Technical Analysis | |
|---|---|
| Overall: |  |
| Target: | Six months: 22.48 One year: 23.44 |
| Support: | Support1: 17.92 Support2: 14.91 |
| Resistance: | Resistance1: 19.25 Resistance2: 20.07 |
| Pivot: | 18.36 |
| Moving Averages: | MA(5): 18.35 MA(20): 18.48 MA(100): 18.89 MA(250): 19.57 |
| MACD: | MACD(12,26): -0.21 Signal(12,26,9): -0.23 |
| %K %D: | %K(14,3): 18.60 %D(3): 17.32 |
| RSI: | RSI(14): 46.05 |
| 52-Week: | High: 22.64 Low: 16.2 Change(%): 1.4 |
| Average Vol(K): | 3-Month: 3066 10-Days: 3393 |
| Prices Prediction (Update @5:00pm) | ||
|---|---|---|
| If tomorrow: | Open lower | Open higher |
| High: | 18.767 - 18.84 | 18.84 - 18.923 |
| Low: | 18.252 - 18.33 | 18.33 - 18.42 |
| Close: | 18.306 - 18.43 | 18.43 - 18.573 |
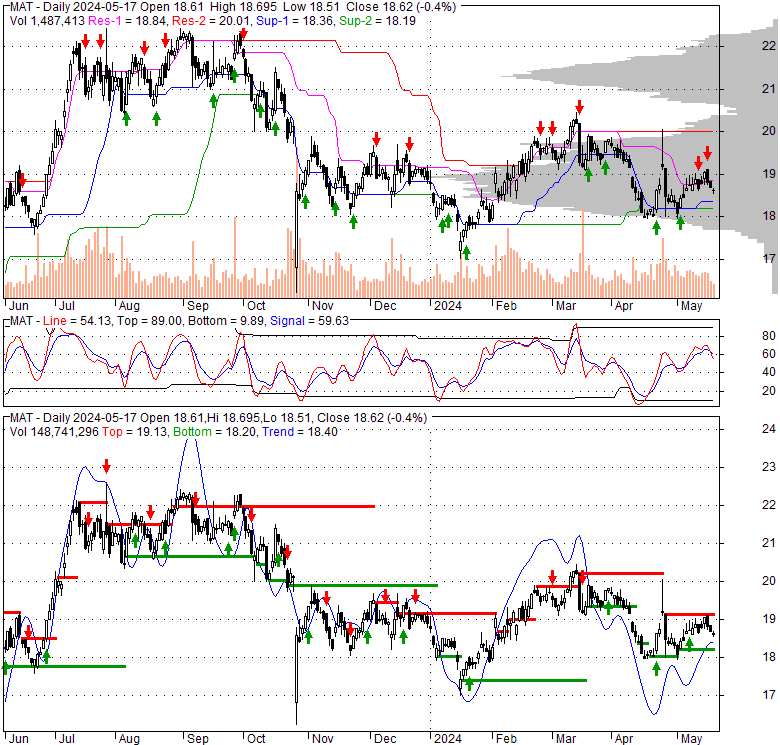
| Price, MAs and Bollinger Bands |
|---|
| Price has closed above its short-term moving average. Short-term moving average is currently below mid-term; and below long-term moving average. From the relationship between price and moving averages: This stock is NEUTRAL in short-term; and NEUTRAL in mid-long term.[ MAT ] has closed below upper band by 43.1%. Bollinger Bands are 7.9% narrower than normal. The current width of the bands does not suggest anything about the future direction or movement of prices. |
| Company profile |
|---|
| Mattel, Inc., a children's entertainment company, designs and produces toys and consumer products worldwide. The company operates through North America, International, and American Girl segments. It offers dolls and accessories, as well as content, gaming, and lifestyle products for children under the Barbie, Monster High, American Girl, Polly Pocket, Spirit, and Enchantimals brands; dolls and books under the American Girl brand name; die-cast vehicles, tracks, playsets, and accessories for kids of all ages, and collectors under the Hot Wheels, Monster Trucks, Matchbox, CARS, and Mario Kart brand names; and infant, toddler, and preschool products comprising content, toys, live events, and other lifestyle products under the Fisher-Price and Thomas & Friends, Power wheels, and Fireman Sam brands. The company also provides action figures, building sets, and games under the Masters of the Universe, MEGA, UNO, Lightyear, Jurassic World, WWE, and Star Wars brands; and licensor partner brands, including Disney, NBCUniversal, WWE, Microsoft, Nickelodeon, Warner Bros, and Sanrio. It sells its products directly to consumers through its catalog, website, and proprietary retail stores; retailers, including discount and free-standing toy stores, chain stores, department stores, and other retail outlets; and wholesalers, as well as through agents and distributors. Mattel, Inc. was founded in 1945 and is headquartered in El Segundo, California. |
| Stock chart |
|---|
 |
| Financial Analysis | |
|---|---|
| Price to Book Value: | Outperform |
| P/BV, a ratio used to compare book value to its current market price, to gauge whether a stock is valued properly. | |
| Price to Earnings: | Underperform |
| PE, the ratio for valuing a company that measures its current share price relative to its earnings per share (EPS). | |
| Discounted cash flow: | Outperform |
| DCF, a valuation method used to estimate the value of an investment based on its expected future cash flows. | |
| Return on Assets: | Underperform |
| ROA, indicates how profitable a company is in relation to its total assets, how efficiently uses assets to generate a profit. | |
| Return on Equity: | Underperform |
| ROE, a measure of financial performance calculated by dividing net income by equity. a gauge of profitability and efficiency. | |
| Debt to Equity: | Outperform |
| evaluate financial leverage, reflects the ability of equity to cover outstanding debts in the event of a business downturn. | |
| Stock Basics & Statistics | |
|---|---|
| Exchange: NASDAQ Global Select | |
| Sector: Consumer Cyclical | |
| Industry: Leisure | |
| Shares Out. (M) | 344.06 |
| Shares Float (M) | 340.59 |
| % Held by Insiders | 0.85 |
| % Held by Institutions | 98.49 |
| Shares Short (K) | 11680 |
| Shares Short Prior Month (K) | 9040 |
| Stock Financials | |
|---|---|
| EPS | 0.600 |
| Book Value (p.s.) | 6.170 |
| Profit Margin | 3.94 |
| Operating Margin | 6.17 |
| Return on Assets (ttm) | 5.8 |
| Return on Equity (ttm) | 10.2 |
| Qtrly Rev. Growth | 15.6 |
| Gross Profit (p.s.) | |
| Sales Per Share | 15.811 |
| EBITDA (p.s.) | 2.378 |
| Qtrly Earnings Growth | 809.90 |
| Operating Cash Flow (M) | 869.79 |
| Levered Free Cash Flow (M) | 702.54 |
| Stock Valuation | |
|---|---|
| PE Ratio | 30.75 |
| PEG Ratio | 1.19 |
| Price to Book value | 2.99 |
| Price to Sales | 1.17 |
| Price to Cash Flow | 7.30 |
| Stock Dividends | |
|---|---|
| Dividend | |
| Dividend Yield | |
| Dividend Growth | |


