| M.D.C. Holdings (MDC) | |||
|---|---|---|---|
| 62.98 0.03 (0.05%) | 04-18 16:00 | ||
| Open: | 62.98 | Pre. Close: | 62.95 |
| High: | 62.99 | Low: | 62.97 |
| Volume: | 6,413,743 | Market Cap: | 4,727(M) |
| Stock Technical Analysis | |
|---|---|
| Overall: |  |
| Target: | Six months: 73.57 One year: 85.93 |
| Support: | Support1: 62.76 Support2: 62.62 |
| Resistance: | Resistance1: 62.99 Resistance2: 73.57 |
| Pivot: | 62.93 |
| Moving Averages: | MA(5): 62.94 MA(20): 62.91 MA(100): 58.60 MA(250): 49.65 |
| MACD: | MACD(12,26): 0.13 Signal(12,26,9): 0.17 |
| %K %D: | %K(14,3): 85.18 %D(3): 70.37 |
| RSI: | RSI(14): 65.52 |
| 52-Week: | High: 63 Low: 36.47 Change(%): 59.2 |
| Average Vol(K): | 3-Month: 2071 10-Days: 3158 |
| Prices Prediction (Update @5:00pm) | ||
|---|---|---|
| If tomorrow: | Open lower | Open higher |
| High: | 63.07 - 63.376 | 63.376 - 63.678 |
| Low: | 62.025 - 62.419 | 62.419 - 62.807 |
| Close: | 62.224 - 62.846 | 62.846 - 63.458 |
| Price, MAs and Bollinger Bands |
|---|
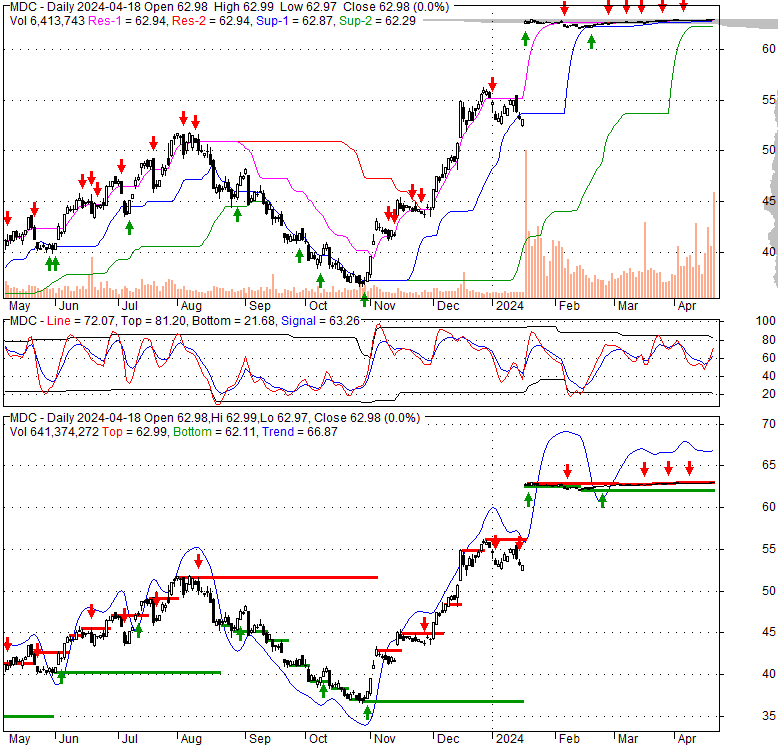
| Price has closed above its short-term moving average. Short-term moving average is currently above mid-term; and above long-term moving average. From the relationship between price and moving averages: This stock is BULLISH in short-term; and BULLISH in mid-long term.[ MDC ] has closed below upper band by 9.6%. Bollinger Bands are 97.3% narrower than normal. The narrow width of the bands suggests low volatility as compared to its normal range. The bands have been in this narrow range for 49 bars. This is a sign that the market may be about to initiate a new trend. |
| Company profile |
|---|
| M.D.C. Holdings, Inc., through its subsidiaries, engages in the homebuilding and financial service businesses. Its homebuilding operations include purchasing finished lots or developing lots for the construction and sale primarily of single-family detached homes to first-time and first-time move-up homebuyers under the Richmond American Homes name. The company conducts its homebuilding operations in Arizona, California, Nevada, New Mexico, Oregon, Texas, Washington, Colorado, Idaho, Utah, Maryland, Pennsylvania, Virginia, Tennessee, and Florida. Its financial services operations comprise originating mortgage loans primarily for homebuyers; providing insurance coverage primarily to its homebuilding subsidiaries and subcontractors for homes sold by its homebuilding subsidiaries, and for work performed in completed subdivisions; acting as a re-insurer on the claims; selling third-party personal property and casualty insurance products to homebuyers; and offering title agency services to homebuilding subsidiaries and customers in Colorado, Florida, Maryland, Nevada, and Virginia. M.D.C. Holdings, Inc. was founded in 1972 and is headquartered in Denver, Colorado. |
| Stock chart |
|---|
 |
| Financial Analysis | |
|---|---|
| Price to Book Value: | Neutral |
| P/BV, a ratio used to compare book value to its current market price, to gauge whether a stock is valued properly. | |
| Price to Earnings: | Neutral |
| PE, the ratio for valuing a company that measures its current share price relative to its earnings per share (EPS). | |
| Discounted cash flow: | Underperform |
| DCF, a valuation method used to estimate the value of an investment based on its expected future cash flows. | |
| Return on Assets: | Outperform |
| ROA, indicates how profitable a company is in relation to its total assets, how efficiently uses assets to generate a profit. | |
| Return on Equity: | Outperform |
| ROE, a measure of financial performance calculated by dividing net income by equity. a gauge of profitability and efficiency. | |
| Debt to Equity: | Neutral |
| evaluate financial leverage, reflects the ability of equity to cover outstanding debts in the event of a business downturn. | |
| Stock Basics & Statistics | |
|---|---|
| Exchange: New York Stock Exchange | |
| Sector: Consumer Cyclical | |
| Industry: Residential Construction | |
| Shares Out. (M) | 75.05 |
| Shares Float (M) | 74.58 |
| % Held by Insiders | 30.47 |
| % Held by Institutions | 79.24 |
| Shares Short (K) | 2500 |
| Shares Short Prior Month (K) | 2540 |
| Stock Financials | |
|---|---|
| EPS | 5.290 |
| Book Value (p.s.) | 45.240 |
| Profit Margin | 8.64 |
| Operating Margin | 10.80 |
| Return on Assets (ttm) | 5.5 |
| Return on Equity (ttm) | 12.4 |
| Qtrly Rev. Growth | -11.4 |
| Gross Profit (p.s.) | |
| Sales Per Share | 61.825 |
| EBITDA (p.s.) | 6.761 |
| Qtrly Earnings Growth | 43.90 |
| Operating Cash Flow (M) | 561.63 |
| Levered Free Cash Flow (M) | 357.57 |
| Stock Valuation | |
|---|---|
| PE Ratio | 11.91 |
| PEG Ratio | 0.87 |
| Price to Book value | 1.39 |
| Price to Sales | 1.02 |
| Price to Cash Flow | 8.42 |
| Stock Dividends | |
|---|---|
| Dividend | |
| Dividend Yield | |
| Dividend Growth | |