| Mdu Res Group Inc (MDU) | |||
|---|---|---|---|
| 24.67 -0.13 (-0.52%) | 04-26 16:00 | ||
| Open: | 24.76 | Pre. Close: | 24.8 |
| High: | 24.93 | Low: | 24.66 |
| Volume: | 788,624 | Market Cap: | 5,025(M) |
| Stock Technical Analysis | |
|---|---|
| Overall: |  |
| Target: | Six months: 30.12 One year: 35.18 |
| Support: | Support1: 24.03 Support2: 22.95 |
| Resistance: | Resistance1: 25.79 Resistance2: 30.12 |
| Pivot: | 24.33 |
| Moving Averages: | MA(5): 24.57 MA(20): 24.56 MA(100): 21.37 MA(250): 20.58 |
| MACD: | MACD(12,26): 0.34 Signal(12,26,9): 0.40 |
| %K %D: | %K(14,3): 64.15 %D(3): 54.80 |
| RSI: | RSI(14): 60.70 |
| 52-Week: | High: 25.79 Low: 18.04 Change(%): 23.0 |
| Average Vol(K): | 3-Month: 1355 10-Days: 946 |
| Prices Prediction (Update @5:00pm) | ||
|---|---|---|
| If tomorrow: | Open lower | Open higher |
| High: | 24.94 - 25.066 | 25.066 - 25.147 |
| Low: | 24.355 - 24.525 | 24.525 - 24.633 |
| Close: | 24.428 - 24.683 | 24.683 - 24.845 |
| Price, MAs and Bollinger Bands |
|---|
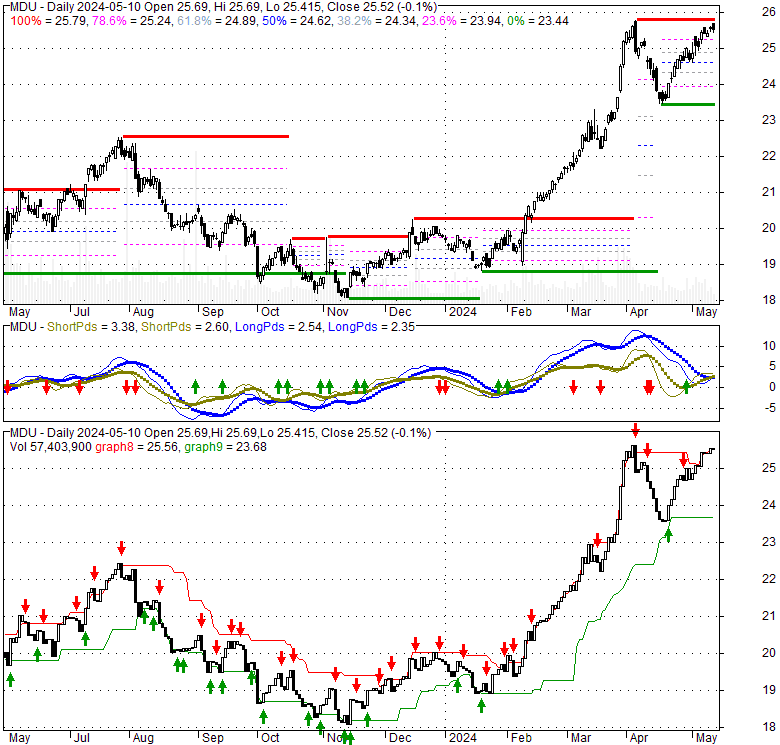
| Price has closed above its short-term moving average. Short-term moving average is currently above mid-term; and above long-term moving average. From the relationship between price and moving averages: This stock is BULLISH in short-term; and BULLISH in mid-long term.[ MDU ] has closed below upper band by 33.3%. Bollinger Bands are 13% wider than normal. The current width of the bands does not suggest anything about the future direction or movement of prices. |
| Company profile |
|---|
| MDU Resources Group, Inc. engages in the regulated energy delivery, and construction materials and services businesses in the United States. The company's Electric segment generates, transmits, and distributes electricity for residential, commercial, industrial, and municipal customers in Montana, North Dakota, South Dakota, and Wyoming, as well as operates 3,500 miles of transmission lines and 4,800 miles of distribution lines. Its Natural Gas Distribution segment distributes natural gas for residential, commercial, and industrial customers in Idaho, Minnesota, Montana, North Dakota, Oregon, South Dakota, Washington, and Wyoming; and offers supply-related value-added services. The company's Pipeline segment provides natural gas transportation and underground storage services through a regulated pipeline system primarily in the Rocky Mountain and northern Great Plains regions; and cathodic protection and other energy-related services. Its Construction Materials and Contracting segment mines, processes, and sells construction aggregates; produces and sells asphalt mix; and supplies ready-mixed concrete. This segment is also involved in the sale of cement, finished concrete products, and other building materials and related contracting services. The company's Construction Services segment designs, constructs, and maintains electrical and communication wiring and infrastructure, fire suppression systems, mechanical piping and services; overhead and underground electrical, gas, and communication infrastructure; and manufactures and distributes transmission lines construction equipment. It serves manufacturing, commercial, industrial, transportation, institutional, and renewable and government customers, as well as utilities. The company was founded in 1924 and is headquartered in Bismarck, North Dakota. |
| Stock chart |
|---|
 |
| Financial Analysis | |
|---|---|
| Price to Book Value: | Underperform |
| P/BV, a ratio used to compare book value to its current market price, to gauge whether a stock is valued properly. | |
| Price to Earnings: | Underperform |
| PE, the ratio for valuing a company that measures its current share price relative to its earnings per share (EPS). | |
| Discounted cash flow: | Underperform |
| DCF, a valuation method used to estimate the value of an investment based on its expected future cash flows. | |
| Return on Assets: | Outperform |
| ROA, indicates how profitable a company is in relation to its total assets, how efficiently uses assets to generate a profit. | |
| Return on Equity: | Outperform |
| ROE, a measure of financial performance calculated by dividing net income by equity. a gauge of profitability and efficiency. | |
| Debt to Equity: | Outperform |
| evaluate financial leverage, reflects the ability of equity to cover outstanding debts in the event of a business downturn. | |
| Stock Basics & Statistics | |
|---|---|
| Exchange: New York Stock Exchange | |
| Sector: Industrials | |
| Industry: Conglomerates | |
| Shares Out. (M) | 203.89 |
| Shares Float (M) | 201.31 |
| % Held by Insiders | 0.63 |
| % Held by Institutions | 72.87 |
| Shares Short (K) | 2770 |
| Shares Short Prior Month (K) | 2140 |
| Stock Financials | |
|---|---|
| EPS | 2.360 |
| Book Value (p.s.) | 14.260 |
| Profit Margin | 8.90 |
| Operating Margin | 12.72 |
| Return on Assets (ttm) | 3.1 |
| Return on Equity (ttm) | 14.8 |
| Qtrly Rev. Growth | -14.1 |
| Gross Profit (p.s.) | |
| Sales Per Share | 22.855 |
| EBITDA (p.s.) | 3.165 |
| Qtrly Earnings Growth | 46.00 |
| Operating Cash Flow (M) | 332.63 |
| Levered Free Cash Flow (M) | 86.44 |
| Stock Valuation | |
|---|---|
| PE Ratio | 10.45 |
| PEG Ratio | -15.66 |
| Price to Book value | 1.73 |
| Price to Sales | 1.08 |
| Price to Cash Flow | 15.12 |
| Stock Dividends | |
|---|---|
| Dividend | |
| Dividend Yield | |
| Dividend Growth | |