| Marsh & Mclennan Companies (MMC) | |||
|---|---|---|---|
| 199.27 -0.09 (-0.05%) | 05-03 16:00 | ||
| Open: | 198.79 | Pre. Close: | 199.36 |
| High: | 199.84 | Low: | 196.72 |
| Volume: | 1,039,121 | Market Cap: | 98,185(M) |
| Stock Technical Analysis | |
|---|---|
| Overall: |  |
| Target: | Six months: 236.58 One year: 241.19 |
| Support: | Support1: 196.17 Support2: 163.21 |
| Resistance: | Resistance1: 202.55 Resistance2: 206.50 |
| Pivot: | 199.68 |
| Moving Averages: | MA(5): 199.26 MA(20): 200.11 MA(100): 198.48 MA(250): 192.92 |
| MACD: | MACD(12,26): -0.86 Signal(12,26,9): -0.84 |
| %K %D: | %K(14,3): 31.91 %D(3): 31.31 |
| RSI: | RSI(14): 44.91 |
| 52-Week: | High: 209.2 Low: 171.47 Change(%): 11.1 |
| Average Vol(K): | 3-Month: 1607 10-Days: 1565 |
| Prices Prediction (Update @5:00pm) | ||
|---|---|---|
| If tomorrow: | Open lower | Open higher |
| High: | 200.046 - 201.137 | 201.137 - 202.044 |
| Low: | 194.039 - 195.417 | 195.417 - 196.563 |
| Close: | 197.178 - 199.297 | 199.297 - 201.057 |
| Price, MAs and Bollinger Bands |
|---|
| Price has closed above its short-term moving average. Short-term moving average is currently below mid-term; and above long-term moving average. From the relationship between price and moving averages: This stock is NEUTRAL in short-term; and NEUTRAL in mid-long term.[ MMC ] has closed above bottom band by 44.4%. Bollinger Bands are 32.6% narrower than normal. The current width of the bands does not suggest anything about the future direction or movement of prices. |
| Company profile |
|---|
| Marsh & McLennan Companies, Inc., a professional services company, provides advice and solutions to clients in the areas of risk, strategy, and people worldwide. It operates in two segments, Risk and Insurance Services, and Consulting. The Risk and Insurance Services segment offers risk management services, such as risk advice, risk transfer, and risk control and mitigation solutions, as well as insurance and reinsurance broking, catastrophe and financial modeling, and related advisory services; and insurance program management services. This segment serves businesses, public entities, insurance companies, associations, professional services organizations, and private clients. The Consulting segment provides health, wealth, and career consulting services and products; and specialized management, as well as economic and brand consulting services. Marsh & McLennan Companies, Inc. was founded in 1871 and is headquartered in New York, New York. |
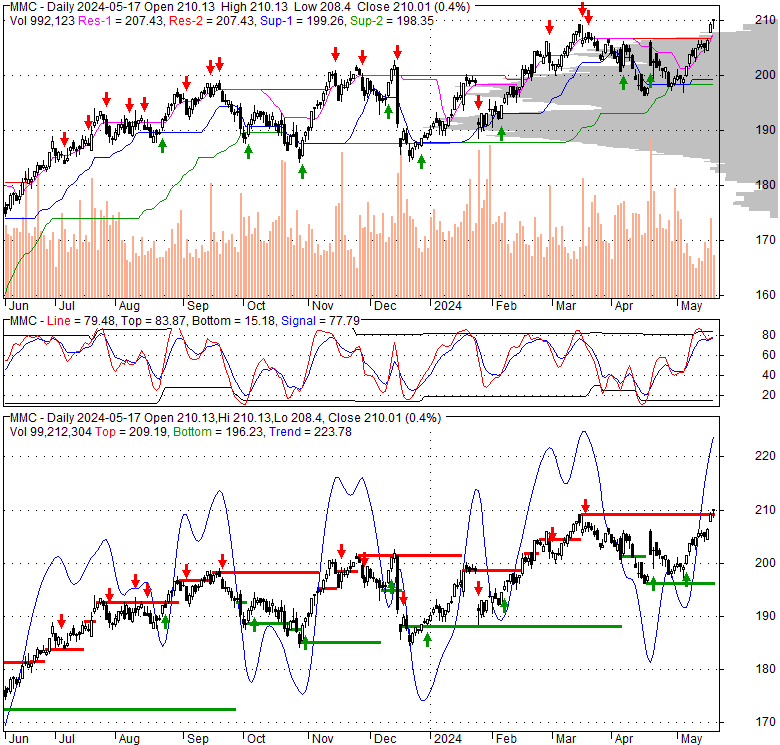
| Stock chart |
|---|
 |
| Stock News |
|---|
|
Sat, 04 May 2024 Royals' Alec Marsh: Making rehab start Sunday - CBS Sports Fri, 03 May 2024 Alec Bohm, Brandon Marsh lead surging Phillies to 4-3 win over Giants - The Associated Press Thu, 02 May 2024 Broughton Marsh Park has new dam for Sheboygan Marsh - Sheboygan Press Thu, 02 May 2024 Nowhere to go, no rules applied, homeless people camp in marsh - WXOW.com Thu, 02 May 2024 Darla Jean Marsh, Hubbard, Ohio - WKBN.com Wed, 01 May 2024 Welcome to Marsh Chapel - Boston University |
| Financial Analysis | |
|---|---|
| Price to Book Value: | Outperform |
| P/BV, a ratio used to compare book value to its current market price, to gauge whether a stock is valued properly. | |
| Price to Earnings: | Outperform |
| PE, the ratio for valuing a company that measures its current share price relative to its earnings per share (EPS). | |
| Discounted cash flow: | Neutral |
| DCF, a valuation method used to estimate the value of an investment based on its expected future cash flows. | |
| Return on Assets: | Outperform |
| ROA, indicates how profitable a company is in relation to its total assets, how efficiently uses assets to generate a profit. | |
| Return on Equity: | Outperform |
| ROE, a measure of financial performance calculated by dividing net income by equity. a gauge of profitability and efficiency. | |
| Debt to Equity: | Outperform |
| evaluate financial leverage, reflects the ability of equity to cover outstanding debts in the event of a business downturn. | |
| Stock Basics & Statistics | |
|---|---|
| Exchange: New York Stock Exchange | |
| Sector: Financial Services | |
| Industry: Insurance - Brokers | |
| Shares Out. (M) | 492.72 |
| Shares Float (M) | 491.48 |
| % Held by Insiders | 0.08 |
| % Held by Institutions | 89.78 |
| Shares Short (K) | 3700 |
| Shares Short Prior Month (K) | 3840 |
| Stock Financials | |
|---|---|
| EPS | 7.870 |
| Book Value (p.s.) | 25.210 |
| Profit Margin | 16.84 |
| Operating Margin | 31.15 |
| Return on Assets (ttm) | 9.3 |
| Return on Equity (ttm) | 33.4 |
| Qtrly Rev. Growth | 9.3 |
| Gross Profit (p.s.) | |
| Sales Per Share | 47.268 |
| EBITDA (p.s.) | 13.842 |
| Qtrly Earnings Growth | 14.20 |
| Operating Cash Flow (M) | 4300.00 |
| Levered Free Cash Flow (M) | 4050.00 |
| Stock Valuation | |
|---|---|
| PE Ratio | 25.32 |
| PEG Ratio | 3.38 |
| Price to Book value | 7.90 |
| Price to Sales | 4.22 |
| Price to Cash Flow | 22.83 |
| Stock Dividends | |
|---|---|
| Dividend | |
| Dividend Yield | |
| Dividend Growth | |